 Indietro
Supply, Demand, and Government Policies: Price Controls, Taxes, and Tax Incidence
Guida di studio - Note intelligenti
 Appunti personalizzati basati sui tuoi materiali, ampliati con definizioni chiave, esempi e contesto.
Chapter 6: Supply, Demand, and Government Policies
Overview of Government Intervention
This chapter explores how government policies such as price controls and taxes affect market equilibrium, create distortions, and influence economic outcomes. The focus is on price ceilings, price floors, and the incidence of taxes, with real-world applications and graphical analysis.
Price Controls
Types and Goals of Price Controls
Price Ceiling: A legal maximum price for a good or service (e.g., rent control, fuel caps).
Price Floor: A legal minimum price (e.g., minimum wage, crop supports).
Goal: Alter market prices for perceived fairness.
Distortion: Creates shortages or surpluses by blocking equilibrium.
Price Ceilings
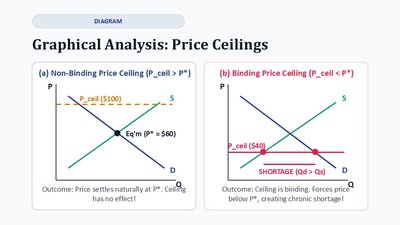
A Price Ceiling is a legal maximum on the price at which a good can be sold. It sets an upper boundary that market prices cannot exceed.
Non-Binding: Ceiling is set above equilibrium price (). Market forces push price toward equilibrium, so the regulation has no effect.
Binding (Restrictive): Ceiling is set below equilibrium price (). Market cannot reach equilibrium price legally, resulting in a persistent shortage ().
Case Study: Student Rent Control
Setting: Universities in Hanoi & HCMC with high student demand for housing.
Free Market: Studio rent at 4,500,000 VND/month.
Policy Proposal: Impose a rent ceiling at 2,500,000 VND/month.
Short Run: Only a modest shortage initially due to inelastic supply and demand.
Long Run: Highly elastic supply and demand lead to massive chronic housing shortages as landlords convert apartments and builders halt construction.
Unintended Consequences of Price Ceilings
Rationing Queues & Waiting Lists: Time wasted in queues or searching for housing.
Landlord Discrimination & Bias: Landlords select tenants by connections or background.
Black Markets & Bribery Fees: Illegal charges and under-the-table payments.
Severe Degradation of Quality: Reduced incentive for landlords to maintain properties.
Price Floors
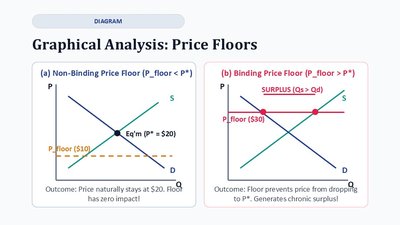
A Price Floor is a legal minimum on the price at which a good can be sold. It sets a lower boundary that market prices cannot drop below.
Non-Binding: Floor is set below equilibrium price (). Market price settles at equilibrium, so the regulation has no effect.
Binding (Restrictive): Floor is set above equilibrium price (). Market price cannot legally drop to equilibrium, resulting in a persistent surplus ().
The Labor Market & Minimum Wage
Market for Unskilled Labor: Minimum wage () creates unemployment when labor supplied () exceeds labor demanded ().
For Employed Workers: Income increases from equilibrium wage to minimum wage.
For Job Seekers: Involuntary unemployment among low-skilled and teenage workers.
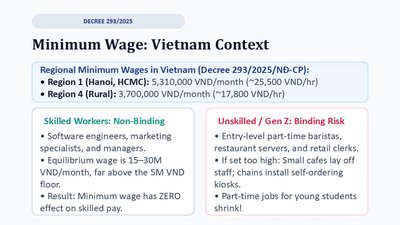
Minimum Wage: Vietnam Context
Regional Minimum Wages: Region 1 (Hanoi, HCMC): 5,310,000 VND/month; Region 4 (Rural): 3,700,000 VND/month.
Skilled Workers: Non-binding, as equilibrium wage is much higher.
Unskilled/Gen Z: Binding risk for entry-level jobs, leading to shrinking job opportunities.
Taxes and Tax Incidence
Key Definition: Tax Incidence
Tax Incidence is the manner in which the burden of a tax is divided between buyers and sellers. The party remitting cash to the tax agency does not necessarily bear the economic cost.
Policy Experiment: Bubble Tea Tax
Case A: Government collects tax from buyers.
Case B: Government collects tax from sellers.
Common Intuition: "Whoever receives the tax bill bears the cost." (This is often incorrect.)
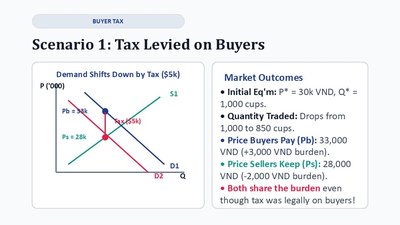
Scenario 1: Tax Levied on Buyers
Demand shifts down by the tax amount.
Market Outcomes: Price buyers pay increases, price sellers receive decreases, quantity traded falls.
Both share the burden even though tax is legally on buyers.
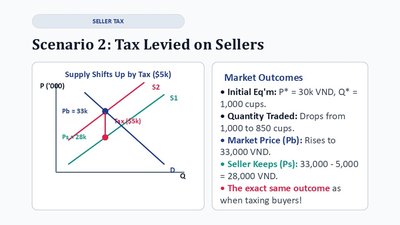
Scenario 2: Tax Levied on Sellers
Supply shifts up by the tax amount.
Market Outcomes: Price buyers pay increases, price sellers receive decreases, quantity traded falls.
Exact same outcome as taxing buyers.
The Equivalence Theorem of Tax Incidence
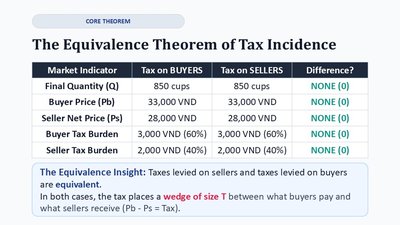
Taxes levied on sellers and taxes levied on buyers are equivalent. In both cases, the tax places a wedge of size T between what buyers pay and what sellers receive ().
Market Indicator | Tax on BUYERS | Tax on SELLERS | Difference? |
|---|---|---|---|
Final Quantity (Q) | 850 cups | 850 cups | NONE (0) |
Buyer Price (Pb) | 33,000 VND | 33,000 VND | NONE (0) |
Seller Net Price (Ps) | 28,000 VND | 28,000 VND | NONE (0) |
Buyer Tax Burden | 3,000 VND (60%) | 3,000 VND (60%) | NONE (0) |
Seller Tax Burden | 2,000 VND (40%) | 2,000 VND (40%) | NONE (0) |
Case Study: Social Insurance (BHXH)
Vietnam Mandatory Payroll Contributions: Total tax wedge = 32% (Employee deduction: 10.5%, Employer contribution: 21.5%).
Layperson's Myth: The split appears generous, but employers view their share as part of total labor compensation.
Economic Reality: Since labor supply is inelastic, workers bear most of the tax in lower take-home pay.
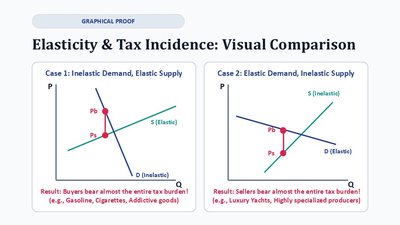
What Determines Tax Incidence? Elasticity!
The burden of a tax falls most heavily on the side of the market that is less elastic (has fewer alternatives).
Elasticity measures flexibility: High elasticity means many alternatives; easy to escape the tax.
Who Gets Stuck with the Tax? The inelastic side bears more of the burden.
Summary Table: Price Controls vs. Taxes
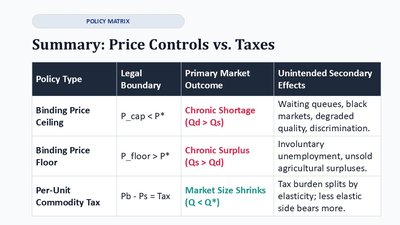
Policy Type | Legal Boundary | Primary Market Outcome | Unintended Secondary Effects |
|---|---|---|---|
Binding Price Ceiling | P_cap < P* | Chronic Shortage (Qd > Qs) | Waiting queues, black markets, degraded quality, discrimination. |
Binding Price Floor | P_floor > P* | Chronic Surplus (Qs > Qd) | Involuntary unemployment, unsold agricultural surpluses. |
Per-Unit Commodity Tax | Pb - Ps = Tax | Market Size Shrinks (Q < Q*) | Tax burden splits by elasticity; less elastic side bears more. |
Key Takeaways
Good intentions ≠ good outcomes: Price controls disrupt market clearing and spawn black markets.
The Equivalence Theorem: Legal tax liability does not dictate economic tax burden.
Elasticity is destiny: The side with fewer alternatives bears the brunt of any tax.
Discussion: Policy Management in Vietnam
The government periodically adjusts retail fuel prices rather than letting them float freely. What trade-offs does this involve?
A tax on rice vs a tax on imported chocolate: Which tax's burden falls more on consumers?
Vietnam applies a special consumption tax on beer. Who bears more of the burden—brewers or drinkers? Why?
