Indietro
The Costs of Taxation: Deadweight Loss, Tax Distortion, and the Laffer Curve
Guida di studio - Note intelligenti
 Appunti personalizzati basati sui tuoi materiali, ampliati con definizioni chiave, esempi e contesto.
Application — The Costs of Taxation
Introduction
This chapter explores the economic consequences of taxation, focusing on deadweight loss, tax distortion, and the Laffer Curve. It analyzes how taxes affect market equilibrium, social welfare, and government revenue, providing both theoretical and real-world perspectives.
The Anatomy of a Tax Wedge
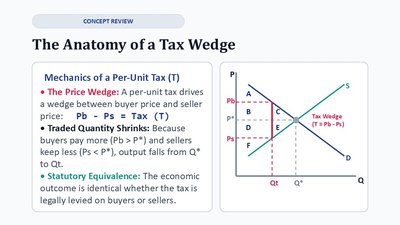
Mechanics of a Per-Unit Tax
The Price Wedge: A per-unit tax creates a gap between the price buyers pay (Pb) and the price sellers receive (Ps). The wedge equals the tax amount (T):
Traded Quantity Shrinks: The tax reduces the equilibrium quantity from Q* to Qt because buyers pay more and sellers receive less.
Statutory Equivalence: The economic outcome is identical whether the tax is levied on buyers or sellers.
Welfare Effects of a Per-Unit Tax
Social Surplus and Deadweight Loss
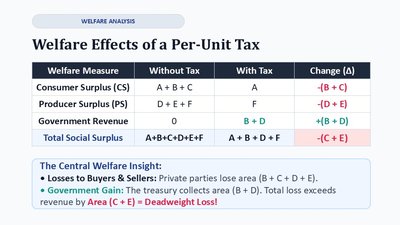
Consumer Surplus (CS): Falls by area B + C.
Producer Surplus (PS): Falls by area D + E.
Government Revenue: Gains area B + D.
Total Social Surplus: Falls by area C + E, which is the deadweight loss (DWL).
Welfare Measure | Without Tax | With Tax | Change (Δ) |
|---|---|---|---|
Consumer Surplus (CS) | A + B + C | A | -{B + C} |
Producer Surplus (PS) | D + E + F | F | -{D + E} |
Government Revenue | 0 | B + D | +{B + D} |
Total Social Surplus | A + B + C + D + E + F | A + B + D + F | -(C + E) |
Visualizing Tax Revenue & Deadweight Loss
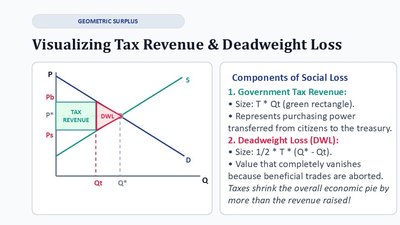
Components of Social Loss
Government Tax Revenue: (green rectangle). Represents purchasing power transferred from citizens to the treasury.
Deadweight Loss (DWL): (triangle). Represents lost mutual gains from trade due to prevented transactions.
What Causes Deadweight Loss?
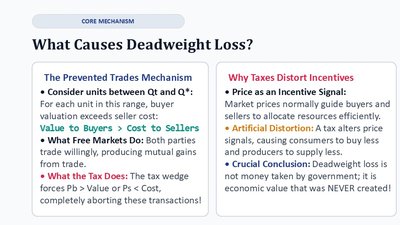
The Prevented Trades Mechanism
For units between Qt and Q*, buyer value exceeds seller cost, but the tax wedge prevents these trades.
Free Markets: All mutually beneficial trades occur.
With Tax: Tax wedge aborts these transactions, causing deadweight loss.
Why Taxes Distort Incentives
Price as an Incentive Signal: Taxes alter price signals, causing consumers and producers to change behavior.
Artificial Distortion: Deadweight loss is not money taken by government; it is economic value that never existed.
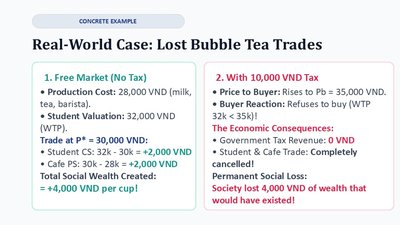
Real-World Example: Lost Bubble Tea Trades
Case Study
Free Market (No Tax): Production cost = 28,000 VND; student valuation = 32,000 VND; trade at 30,000 VND creates 4,000 VND of social wealth per cup.
With 10,000 VND Tax: Price rises to 35,000 VND; buyer refuses to buy; trade is cancelled; government revenue = 0; permanent social loss = 4,000 VND per cup.
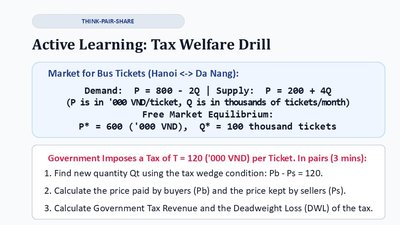
Active Learning: Tax Welfare Drill
Market for Bus Tickets
Demand: P = 800 - 2Q
Supply: P = 200 + 4Q
Free Market Equilibrium: P* = 600 ('000 VND), Q* = 100 thousand tickets
Tax Imposed: T = 120 ('000 VND) per ticket
Find new quantity Qt using tax wedge: Pb - Ps = 120
Calculate Pb (price paid by buyers) and Ps (price received by sellers)
Calculate government tax revenue and deadweight loss
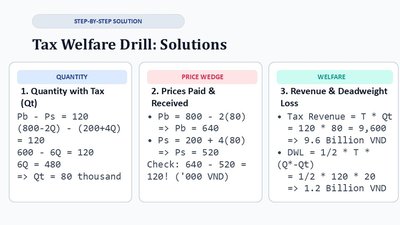
Step-by-Step Solution
Quantity with Tax: thousand
Prices Paid & Received: Check: ('000 VND)
Revenue & Deadweight Loss: Tax Revenue: Billion VND DWL: Billion VND
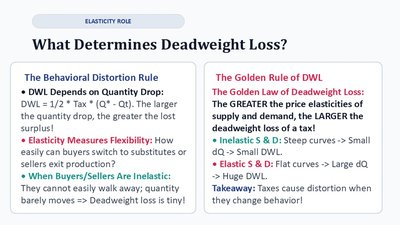
What Determines Deadweight Loss?
The Behavioral Distortion Rule
DWL depends on the drop in quantity:
Elasticity Measures Flexibility: The more easily buyers and sellers can substitute or exit, the larger the quantity drop and the greater the lost surplus.
Inelastic Markets: Quantity barely changes; DWL is tiny.
The Golden Rule of DWL
The greater the price elasticities of supply and demand, the larger the deadweight loss of a tax.
Inelastic S & D: Steep curves → Small dQ → Small DWL
Elastic S & D: Flat curves → Large dQ → Huge DWL
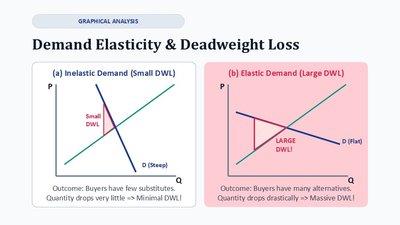
Demand Elasticity & Deadweight Loss
Graphical Analysis
Inelastic Demand: Steep demand curve; buyers have few substitutes; quantity drops very little; minimal DWL.
Elastic Demand: Flat demand curve; buyers have many alternatives; quantity drops drastically; massive DWL.
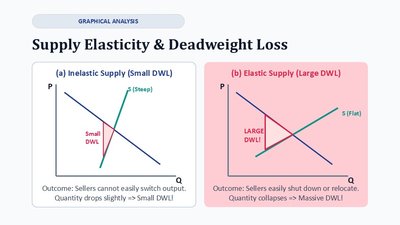
Supply Elasticity & Deadweight Loss
Graphical Analysis
Inelastic Supply: Steep supply curve; sellers cannot easily switch output; quantity drops slightly; small DWL.
Elastic Supply: Flat supply curve; sellers easily shut down or relocate; quantity collapses; massive DWL.
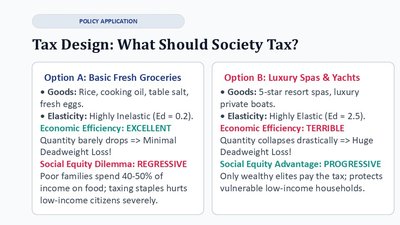
Tax Design: What Should Society Tax?
Policy Application
Option A: Basic Fresh Groceries Goods: Rice, cooking oil, table salt, fresh eggs Elasticity: Highly inelastic (Ed = 0.2) Economic Efficiency: Excellent (minimal DWL) Social Equity Dilemma: Regressive (hurts low-income families)
Option B: Luxury Spas & Yachts Goods: 5-star resort spas, luxury private boats Elasticity: Highly elastic (Ed = 2.5) Economic Efficiency: Terrible (huge DWL) Social Equity Advantage: Progressive (targets wealthy)
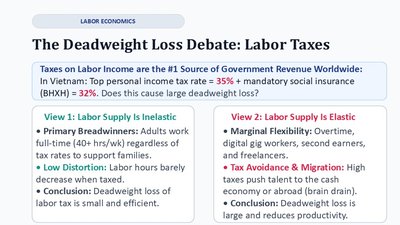
The Deadweight Loss Debate: Labor Taxes
Labor Economics
Taxes on Labor Income: Major source of government revenue worldwide.
View 1: Labor Supply Is Inelastic: Adults work full-time regardless of tax rates; low distortion; DWL is small.
View 2: Labor Supply Is Elastic: Overtime, gig work, migration; taxes push talent abroad; DWL is large and reduces productivity.
How Tax Size Multiplies Deadweight Loss
Non-Linear Growth
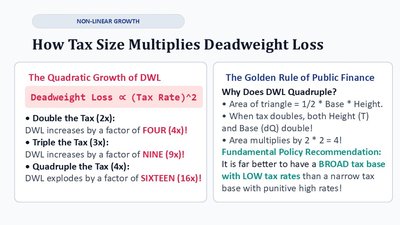
Quadratic Growth of DWL: Doubling the tax increases DWL by a factor of four; tripling by nine; quadrupling by sixteen.
Golden Rule of Public Finance: Broad tax base with low rates is preferable to narrow base with high rates.
The Laffer Curve: Tax Size vs. Revenue
Supply-Side Economics
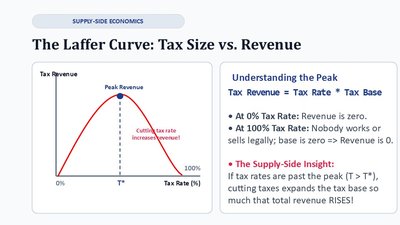
Tax Revenue Formula:
At 0% tax rate, revenue is zero; at 100% tax rate, revenue is zero (no legal activity).
Supply-Side Insight: If tax rates exceed the peak, cutting rates can increase total revenue.
Case Study: Supply-Side Economics
Policy Case Study
Reagan's 1980s Tax Cuts: Claimed to stimulate work and investment; total revenue did not rise, but rich earners paid more because they stopped using tax shelters.
Vietnam Corporate Tax Strategy: Competitive 20% CIT; capital is hyper-elastic; keeping rates competitive attracts foreign capital.

Check Your Understanding: Quick Poll
Elasticity & DWL
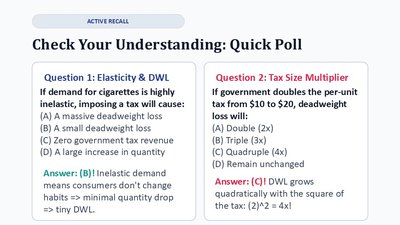
If demand for cigarettes is highly inelastic, imposing a tax will cause: Answer: Small deadweight loss (B)
Tax Size Multiplier
If government doubles the per-unit tax from $10 to $20, deadweight loss will: Answer: Quadruple (C)
Master Summary: Economics of Taxation
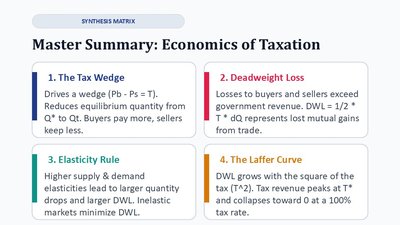
The Tax Wedge: Drives a wedge (Pb - Ps = T), reduces equilibrium quantity, buyers pay more, sellers receive less.
Deadweight Loss: Losses to buyers and sellers exceed government revenue; DWL = 1/2 * T * dQ.
Elasticity Rule: Higher supply and demand elasticities lead to larger quantity drops and larger DWL; inelastic markets minimize DWL.
The Laffer Curve: DWL grows with the square of the tax (T^2); tax revenue peaks at T* and collapses toward 0 at 100% tax rate.
Takeaways
Taxes Are Necessary: Governments need taxes to finance public goods.
The Economist's Goal: Design tax policies that raise required funds with minimal economic distortion (low DWL).
Balance: Always balance efficiency (low DWL) against equity (protecting vulnerable citizens).