Indietro
Thinking Like an Economist: Foundations of Microeconomic Analysis
Guida di studio - Note intelligenti
 Appunti personalizzati basati sui tuoi materiali, ampliati con definizioni chiave, esempi e contesto.
Thinking Like an Economist
Introduction
This chapter introduces the foundational methods and models used in microeconomics. It covers the scientific approach to economic reasoning, the use of assumptions and models, and key frameworks such as the Circular-Flow Diagram and the Production Possibilities Frontier (PPF). The distinction between positive and normative analysis is also explored, providing students with the tools to think critically about economic issues.
Economic Methodology
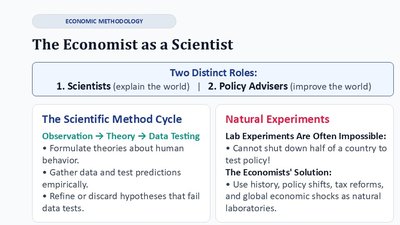
The Economist as a Scientist
Economists play two main roles: explaining the world (scientists) and improving it (policy advisers). The scientific method is central to economic inquiry, involving observation, theory development, and empirical testing.
Scientific Method Cycle:
Observation → Theory → Data Testing
Formulate theories about human behavior.
Gather data and test predictions empirically.
Refine or discard hypotheses that fail data tests.
Natural Experiments:
Lab experiments are often impossible in economics.
Economists use history, policy shifts, and global shocks as natural experiments.
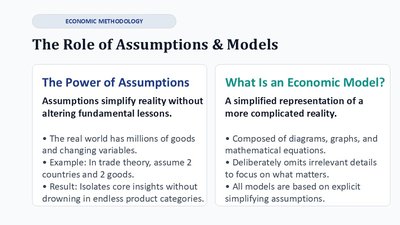
The Role of Assumptions & Models
Assumptions and models are essential tools for simplifying complex economic realities without losing core insights.
The Power of Assumptions:
Assumptions simplify reality, making analysis manageable.
Example: In trade theory, assume only two countries and two goods to isolate core insights.
What Is an Economic Model?
A simplified representation of a more complicated reality.
Composed of diagrams, graphs, and equations.
Deliberately omits irrelevant details to focus on what matters.
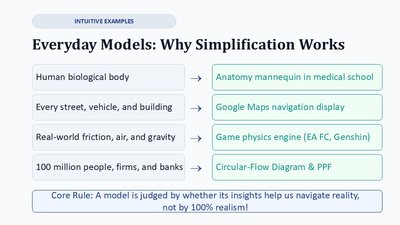
Everyday Models: Why Simplification Works
Models are judged by their ability to provide useful insights, not by perfect realism. Everyday analogies include anatomy mannequins, navigation displays, and game physics engines.
Core Rule: A model is useful if it helps us navigate reality, regardless of its realism.
Economic Models
Model 1: The Circular-Flow Diagram
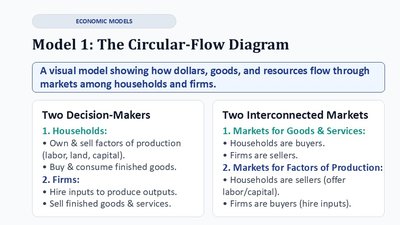
The Circular-Flow Diagram visually represents how dollars, goods, and resources flow through markets among households and firms.
Two Decision-Makers:
Households: Own and sell factors of production (labor, land, capital); buy and consume finished goods.
Firms: Hire inputs to produce outputs; sell finished goods and services.
Two Interconnected Markets:
Markets for Goods & Services: Households buy, firms sell.
Markets for Factors of Production: Households sell (labor/capital), firms buy.
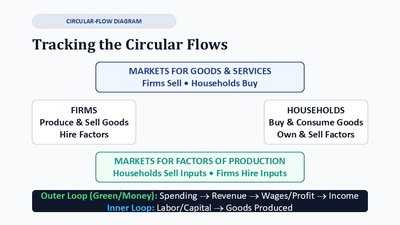
Tracking the Circular Flows
Markets for Goods & Services: Firms sell, households buy.
Markets for Factors of Production: Households sell inputs, firms hire inputs.
Outer Loop (Money): Spending → Revenue → Wages/Profit → Income.
Inner Loop (Goods): Labor/Capital → Goods Produced.
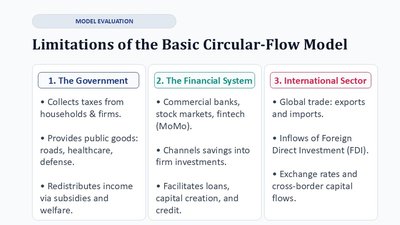
Limitations of the Basic Circular-Flow Model
The Government: Collects taxes, provides public goods, redistributes income.
The Financial System: Channels savings into investments, facilitates loans and credit.
International Sector: Involves global trade, foreign direct investment, and exchange rates.
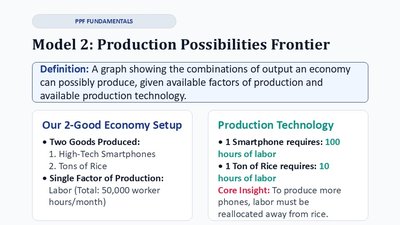
Model 2: Production Possibilities Frontier (PPF)
The PPF is a graph showing the combinations of output an economy can possibly produce, given available factors of production and technology.
2-Good Economy Setup:
Goods: High-Tech Smartphones and Tons of Rice.
Single factor: Labor (e.g., 50,000 worker hours/month).
Production Technology:
1 Smartphone = 100 hours of labor.
1 Ton of Rice = 10 hours of labor.
Core Insight: Producing more of one good requires reallocating labor from the other.
Constructing the PPF: The Production Schedule
The production schedule lists possible combinations of goods produced given the resource constraint.
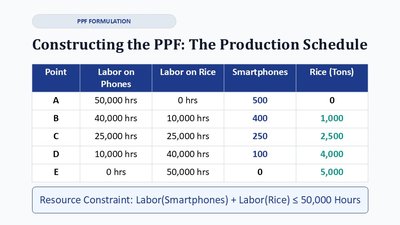
Point | Labor on Phones | Labor on Rice | Smartphones | Rice (Tons) |
|---|---|---|---|---|
A | 50,000 hrs | 0 hrs | 500 | 0 |
B | 40,000 hrs | 10,000 hrs | 400 | 1,000 |
C | 25,000 hrs | 25,000 hrs | 250 | 2,500 |
D | 10,000 hrs | 40,000 hrs | 100 | 4,000 |
E | 0 hrs | 50,000 hrs | 0 | 5,000 |
Resource Constraint: Hours
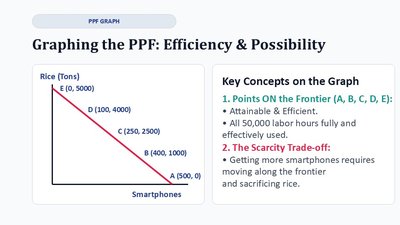
Graphing the PPF: Efficiency & Possibility
Points ON the Frontier (A, B, C, D, E): Attainable and efficient; all resources fully used.
The Scarcity Trade-off: Producing more of one good requires sacrificing some of the other.
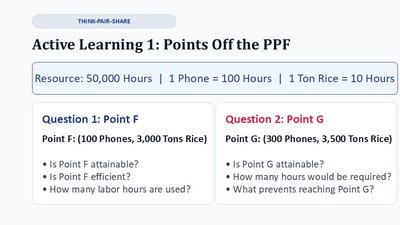
Active Learning: Points Off the PPF
Point F (100 Phones, 3,000 Tons Rice): Attainable but inefficient (not all labor used).
Point G (300 Phones, 3,500 Tons Rice): Unattainable (exceeds available labor hours).
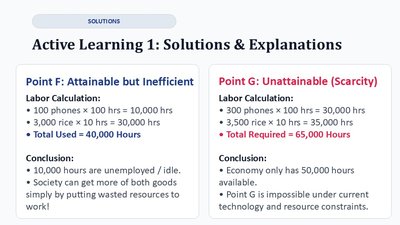
Solutions & Explanations
Point F: Uses only 40,000 hours; 10,000 hours are idle.
Point G: Requires 65,000 hours; unattainable with current resources.
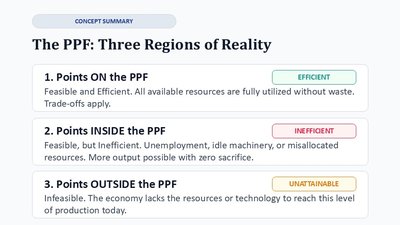
The PPF: Three Regions of Reality
Points ON the PPF (Efficient): Feasible and efficient; all resources fully utilized.
Points INSIDE the PPF (Inefficient): Feasible but inefficient; some resources are idle or misallocated.
Points OUTSIDE the PPF (Unattainable): Infeasible with current resources and technology.
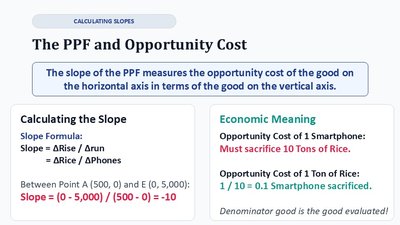
The PPF and Opportunity Cost
The slope of the PPF measures the opportunity cost of the good on the horizontal axis in terms of the good on the vertical axis.
Slope Formula:
Between A (500, 0) and E (0, 5,000):
Economic Meaning:
Opportunity Cost of 1 Smartphone: Must sacrifice 10 Tons of Rice.
Opportunity Cost of 1 Ton of Rice: Smartphone sacrificed.
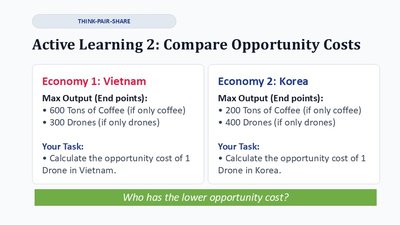
Active Learning: Compare Opportunity Costs
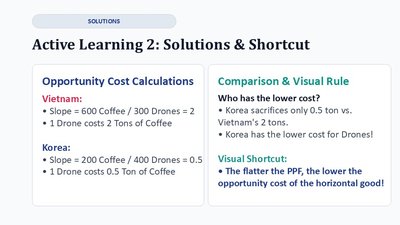
Vietnam: 1 Drone costs 2 Tons of Coffee.
Korea: 1 Drone costs 0.5 Ton of Coffee.
Korea has the lower opportunity cost for drones.
Solutions & Shortcut
Visual Shortcut: The flatter the PPF, the lower the opportunity cost of the horizontal good.
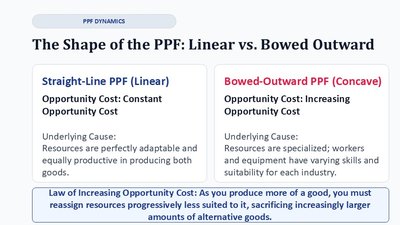
The Shape of the PPF: Linear vs. Bowed Outward
Straight-Line PPF (Linear): Constant opportunity cost; resources are equally productive in both goods.
Bowed-Outward PPF (Concave): Increasing opportunity cost; resources are specialized.
Law of Increasing Opportunity Cost: As you produce more of a good, you must reassign resources less suited to it, sacrificing larger amounts of alternatives.
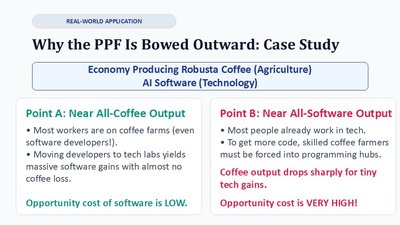
Why the PPF Is Bowed Outward: Case Study
Point A (All-Coffee Output): Opportunity cost of software is low.
Point B (All-Software Output): Opportunity cost of coffee is very high.
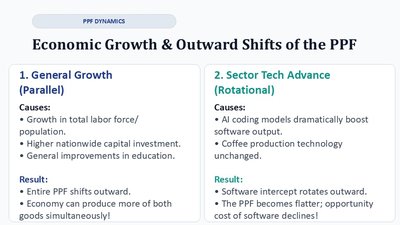
Economic Growth & Outward Shifts of the PPF
General Growth (Parallel Shift): Increases in labor force, capital, or education shift the entire PPF outward.
Sector Tech Advance (Rotational Shift): Advances in one sector (e.g., software) rotate the PPF outward for that good only.
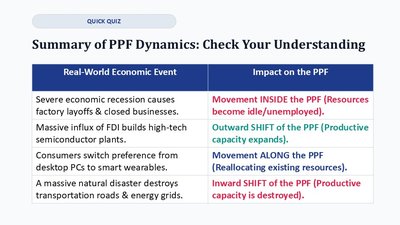
Summary of PPF Dynamics: Check Your Understanding
Real-World Economic Event | Impact on the PPF |
|---|---|
Severe economic recession causes factory layoffs & closed businesses. | Movement INSIDE the PPF (Resources become idle/unemployed). |
Massive influx of FDI builds high-tech semiconductor plants. | Outward SHIFT of the PPF (Productive capacity expands). |
Consumers switch preference from desktop PCs to smart wearables. | Movement ALONG the PPF (Reallocating existing resources). |
A massive natural disaster destroys transportation roads & energy grids. | Inward SHIFT of the PPF (Productive capacity is destroyed). |
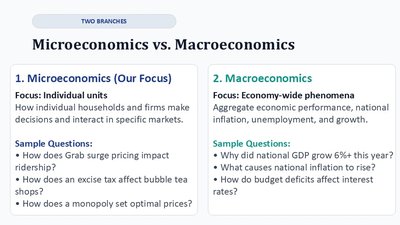
Two Branches: Microeconomics vs. Macroeconomics
Microeconomics: Focuses on individual units (households, firms) and their interactions in specific markets.
Macroeconomics: Focuses on economy-wide phenomena (GDP, inflation, unemployment).
Positive vs. Normative Analysis
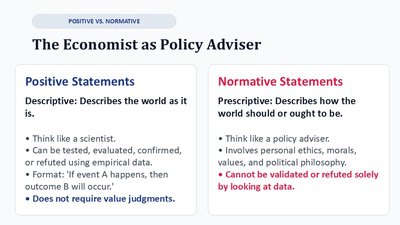
The Economist as Policy Adviser
Positive Statements: Descriptive; can be tested and validated with data. Do not require value judgments.
Normative Statements: Prescriptive; involve values and cannot be validated solely by data.
Positive vs. Normative: Real-World Policy Examples
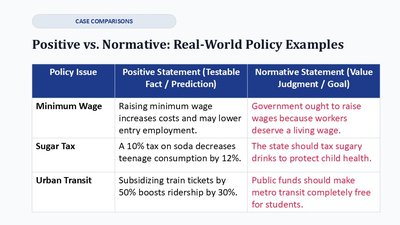
Policy Issue | Positive Statement (Testable Fact / Prediction) | Normative Statement (Value Judgment / Goal) |
|---|---|---|
Minimum Wage | Raising minimum wage increases costs and may lower entry employment. | Government ought to raise wages because workers deserve a living wage. |
Sugar Tax | A 10% tax on soda decreases teenage consumption by 12%. | The state should tax sugary drinks to protect child health. |
Urban Transit | Subsidizing train tickets by 50% boosts ridership by 30%. | Public funds should make metro transit completely free for students. |
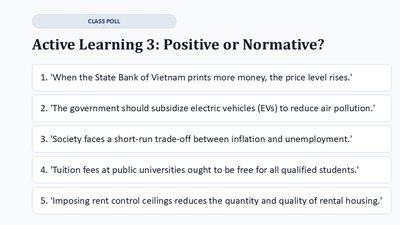
Active Learning: Positive or Normative?
‘When the State Bank of Vietnam prints more money, the price level rises.’ (Positive)
‘The government should subsidize electric vehicles (EVs) to reduce air pollution.’ (Normative)
‘Society faces a short-run trade-off between inflation and unemployment.’ (Positive)
‘Tuition fees at public universities ought to be free for all qualified students.’ (Normative)
‘Imposing rent control ceilings reduces the quantity and quality of rental housing.’ (Positive)