 Indietro
Where Prices Come From: The Interaction of Demand and Supply
Guida di studio - Note intelligenti
 Appunti personalizzati basati sui tuoi materiali, ampliati con definizioni chiave, esempi e contesto.
Chapter 3: Where Prices Come From – The Interaction of Demand and Supply
3.1 The Demand Side of the Market
The demand side of the market focuses on the behavior of consumers and the factors that influence their willingness and ability to purchase goods and services. Understanding demand is essential for analyzing how prices are determined in a market economy.
Quantity Demanded (QD): The amount of a good or service that consumers plan to buy at a particular price during a specified time period, ceteris paribus (all else equal).
Demand Schedule: A table showing the relationship between the price (P) of a product and the quantity demanded (QD).
Demand Curve: A graphical representation showing the relationship between the price of a product and the quantity demanded, holding all other factors constant.
Law of Demand: As the price of a good increases, the quantity demanded decreases, and vice versa. This is an inverse (negative) relationship.
Movement Along vs. Shift of the Demand Curve:
Change in Quantity Demanded: Movement along the demand curve due to a change in the price of the good or service.
Change in Demand: A shift of the entire demand curve due to changes in non-price factors (demand shifters).
Determinants of Demand (Demand Shifters)
Tastes and Preferences: If consumer preferences for a good increase, demand increases (e.g., sports jerseys after a major win).

Population: An increase in the number of potential consumers increases demand (e.g., larger venues require more seats).

Prices of Related Goods:
Complements: Goods consumed together (e.g., peanut butter and jelly). A decrease in the price of one increases demand for the other.

Substitutes: Goods used in place of each other (e.g., Sprite and 7-Up). A decrease in the price of one decreases demand for the other.
Income:
Normal Goods: Demand increases as income increases (e.g., steak, shoes).
Inferior Goods: Demand decreases as income increases (e.g., ramen noodles, generic brands).


Expected Future Prices: If consumers expect prices to rise, current demand increases.
Legality Issues: Legalization of a good increases demand (e.g., alcohol post-Prohibition).
Taxes and Subsidies: Lower taxes or higher subsidies increase demand.

Summary Table: Demand Shifters and Their Effects
Shifter | Increase in Demand | Decrease in Demand |
|---|---|---|
Tastes & Preferences | Positive news/event | Negative news/event |
Population | Population grows | Population shrinks |
Price of Complements | Price of complement falls | Price of complement rises |
Price of Substitutes | Price of substitute rises | Price of substitute falls |
Income (Normal Good) | Income rises | Income falls |
Income (Inferior Good) | Income falls | Income rises |
Expected Future Price | Price expected to rise | Price expected to fall |
Legality | Legalized | Criminalized |
Taxes/Subsidies | Tax falls/Subsidy rises | Tax rises/Subsidy falls |
3.2 The Supply Side of the Market
The supply side of the market examines the behavior of producers and the factors that influence their willingness and ability to sell goods and services. Supply analysis is crucial for understanding how market prices are set.
Quantity Supplied (QS): The amount of a good or service that producers plan to sell at a particular price during a specified time period, ceteris paribus.
Supply Schedule: A table showing the relationship between the price (P) of a product and the quantity supplied (QS).
Supply Curve: A graphical representation showing the relationship between the price of a product and the quantity supplied, holding all other factors constant.
Law of Supply: As the price of a good increases, the quantity supplied increases, and vice versa. This is a direct (positive) relationship.
Movement Along vs. Shift of the Supply Curve:
Change in Quantity Supplied: Movement along the supply curve due to a change in the price of the good or service.
Change in Supply: A shift of the entire supply curve due to changes in non-price factors (supply shifters).
Determinants of Supply (Supply Shifters)
Costs of Production: Lower input costs increase supply.
Opportunity Costs: Lower opportunity costs increase supply.
Technology: Technological improvements increase supply.

Number of Sellers: More sellers increase supply.

Expected Future Prices: If prices are expected to fall, current supply increases.
Legality Issues: Legalization increases supply.
Taxes and Subsidies: Lower taxes or higher subsidies increase supply.

Summary Table: Supply Shifters and Their Effects
Shifter | Increase in Supply | Decrease in Supply |
|---|---|---|
Costs of Production | Costs fall | Costs rise |
Opportunity Costs | Opportunity cost falls | Opportunity cost rises |
Technology | Improves | Worsens |
Number of Sellers | More sellers | Fewer sellers |
Expected Future Price | Price expected to fall | Price expected to rise |
Legality | Legalized | Criminalized |
Taxes/Subsidies | Tax falls/Subsidy rises | Tax rises/Subsidy falls |
3.3 Market Equilibrium: Putting Demand and Supply Together
Market equilibrium occurs where the quantity demanded equals the quantity supplied. This intersection determines the equilibrium price (Pe) and equilibrium quantity (Qe) in the market.
Equilibrium Price (Pe): The price at which QD = QS.
Equilibrium Quantity (Qe): The quantity bought and sold at the equilibrium price.
Surplus: Occurs when the market price is above Pe, so QS > QD. This leads to downward pressure on price. 
Shortage: Occurs when the market price is below Pe, so QD > QS. This leads to upward pressure on price. 
3.4 The Effect of Demand and Supply Shifts on Equilibrium
Changes in demand or supply shift the respective curves, leading to new equilibrium prices and quantities. The direction of the shift determines the effect on Pe and Qe.
Increase in Demand (D↑): Pe increases, Qe increases.
Decrease in Demand (D↓): Pe decreases, Qe decreases.
Increase in Supply (S↑): Pe decreases, Qe increases.
Decrease in Supply (S↓): Pe increases, Qe decreases.
Simultaneous Shifts: When both demand and supply shift, the effect on Pe or Qe may be indeterminate without more information.
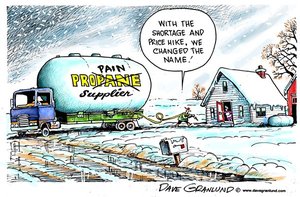
Example: Propane Shortage
A shortage of propane leads to higher prices, as depicted in the cartoon below. This illustrates how a leftward shift in supply (S↓) or a rightward shift in demand (D↑) can create a shortage and drive up prices.
Practice Problems and Applications
Identify whether a scenario involves a shift in demand or supply, and predict the effect on equilibrium price and quantity.
Apply the concepts of complements, substitutes, normal and inferior goods, and the effects of taxes and subsidies to real-world examples.
Key Equations:
Demand Function:
Supply Function:
Equilibrium Condition:
Summary Table: Effects of Shifts on Equilibrium
Case | Effect on Pe | Effect on Qe |
|---|---|---|
D↑ | ↑ | ↑ |
D↓ | ↓ | ↓ |
S↑ | ↓ | ↑ |
S↓ | ↑ | ↓ |
Additional info: These notes provide a comprehensive overview of the interaction of demand and supply, including the determinants of each, the concept of equilibrium, and the effects of shifts in demand and supply on market outcomes. Real-world examples and practice problems are included to reinforce understanding.
