 Indietro
Organic Chemistry II Exam 2 Review – Step-by-Step Guidance
Guida di studio - Note intelligenti
 Appunti personalizzati basati sui tuoi materiali, ampliati con definizioni chiave, esempi e contesto.
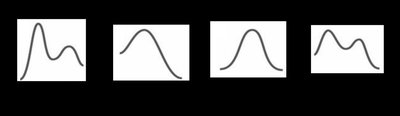
Q14. Consider the relative energy diagram for four different reactions.
Background
Topic: Reaction Energy Diagrams & Thermodynamics
This question tests your understanding of reaction coordinate diagrams, including how to interpret activation energy, the number of steps in a mechanism, and the thermodynamic favorability of reactions (ΔG and Keq).
Key Terms and Concepts:
Activation Energy (Ea): The energy barrier that must be overcome for a reaction to proceed.
ΔG (Gibbs Free Energy Change): Indicates whether a reaction is spontaneous (negative ΔG) or non-spontaneous (positive ΔG).
Keq (Equilibrium Constant): Related to ΔG; if Keq > 1, products are favored.
One-step vs. Multi-step Mechanism: One-step reactions have a single transition state (one peak); multi-step reactions have more than one.
Step-by-Step Guidance
Examine each energy diagram and count the number of peaks (transition states) to determine if the reaction is one-step or multi-step.
Identify which diagram has the highest energy difference between the starting material and the highest point (activation energy).
Compare the energy of reactants and products in each diagram to determine the sign of ΔG (products lower than reactants = negative ΔG, etc.).
Recall that Keq > 1 when products are lower in energy than reactants (ΔG negative), and Keq < 1 when products are higher in energy (ΔG positive).
For ΔG ≈ 0, look for diagrams where the reactants and products are at nearly the same energy level.
Try solving on your own before revealing the answer!
Final Answers:
(A) One-step mechanisms: Diagrams B and C (each has only one peak).
(B) Largest activation energy: Diagram C (tallest peak relative to starting material).
(C) Keq > 1: Diagrams A and B (products lower than reactants).
(D) Positive ΔG: Diagram D (products higher than reactants).
(E) ΔG ≈ 0: Diagram C (products and reactants at similar energy).
These answers are based on the relative positions of reactants, products, and transition states in each diagram.
