Indietro
Motion in One Dimension: Position, Velocity, and Acceleration
Guida di studio - Note intelligenti
 Appunti personalizzati basati sui tuoi materiali, ampliati con definizioni chiave, esempi e contesto.
Motion in One Dimension
Representing Position
In physics, the position of an object describes its location along a straight line, typically measured from a chosen origin. Position is often represented as x and is a function of time t. A motion diagram or a position-versus-time graph can visually represent how an object's position changes over time.
Motion Diagram: Shows the object's position at equal time intervals, helping to visualize its movement.
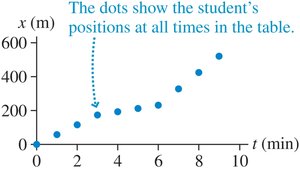
Position-Time Graph: Plots position (x) on the vertical axis and time (t) on the horizontal axis. The slope of this graph indicates the object's velocity.

From Position to Velocity
The velocity of an object describes how its position changes with time. The velocity at any instant is the slope of the position-versus-time graph at that point. A velocity-versus-time graph provides another way to represent motion.
Constant Slope: Indicates constant velocity (straight line on position-time graph).
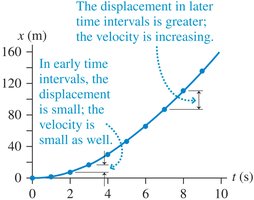
Changing Slope: Indicates changing velocity (curved line on position-time graph).
From Velocity to Position
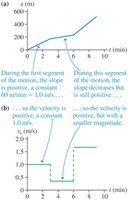
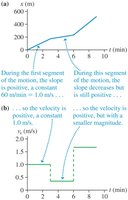
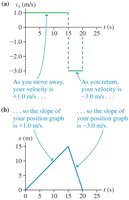
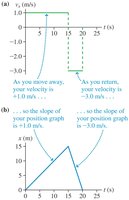
Given a velocity-versus-time graph, you can reconstruct the position-versus-time graph. The sign of the velocity tells you whether the position graph's slope is positive or negative, and the magnitude tells you how steep the slope is.
Positive Velocity: Position increases with time.
Negative Velocity: Position decreases with time.
Uniform Motion
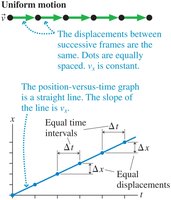
Uniform motion (or constant-velocity motion) occurs when an object moves in a straight line with equal displacements during equal time intervals. The position-versus-time graph for uniform motion is a straight line, and the velocity is constant.
Key Feature: Equal spacing of dots in a motion diagram and a straight line on the position-time graph.
Equations of Uniform Motion
The velocity in uniform motion tells us how much the position changes each second. The displacement is proportional to the time interval:
Equation:
Displacement:
Example: Ratio Reasoning in Uniform Motion
Suppose a train travels 12 km in 10 minutes at constant speed. To find the time to travel 60 km, use ratio reasoning:
Distance ratio:
Time ratio:
Conclusion: For steady motion, the time required is proportional to the distance traveled.
Instantaneous Velocity
Instantaneous velocity is the velocity of an object at a specific instant in time. It is found as the slope of the tangent to the position-versus-time curve at that point.
Graphical Interpretation: The slope of the tangent line at a point on the position-time graph gives the instantaneous velocity.
Acceleration
Acceleration is the rate of change of velocity with respect to time. It is the slope of the velocity-versus-time graph.
Units: Meters per second squared (m/s2).
Equation:
Representing Acceleration
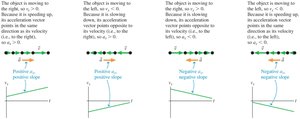
Acceleration can be represented graphically as the slope of the velocity-time graph. The sign of acceleration depends on the direction of motion and whether the object is speeding up or slowing down.
Motion with Constant Acceleration
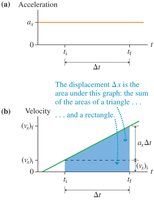
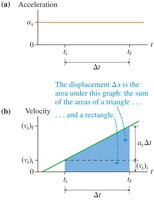
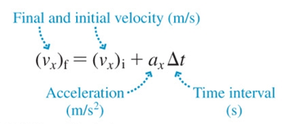
When acceleration is constant, the velocity changes at a steady rate. The position changes as the square of the time interval. The area under the velocity-time graph gives the displacement.
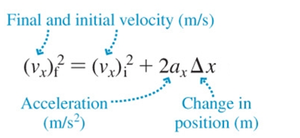
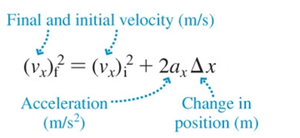
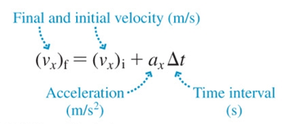
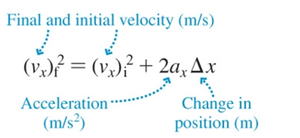
Key Equations:
Example: Coming to a Stop in a Car
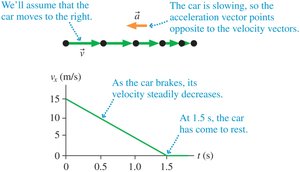
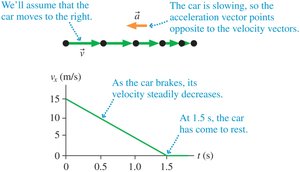
A car traveling at 15 m/s comes to rest in 1.5 s. To find the stopping distance, use the constant acceleration equations:
Initial velocity:
Final velocity:
Time:
Acceleration:
Displacement:
Example: Calculating the Minimum Length of a Runway
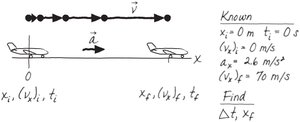
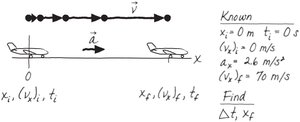
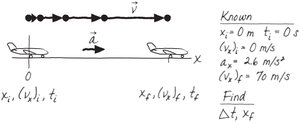
A Boeing 747 accelerates at to a takeoff speed of 70 m/s. To find the time and minimum runway length:
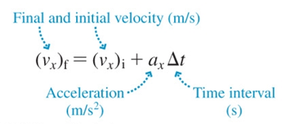
Use to solve for .
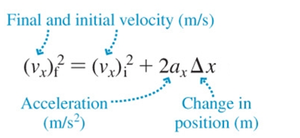
Use to find the runway length.
Free Fall
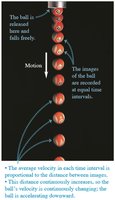
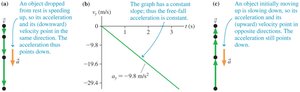
Free fall is the motion of an object under the influence of gravity alone. The acceleration due to gravity is denoted by g and is always directed downward. For calculations on Earth, (always positive by definition).
All objects in free fall experience the same acceleration, regardless of their mass.
The kinematic equations for constant acceleration apply, with for upward motion and for downward motion.
Example: Finding the Height of a Leap
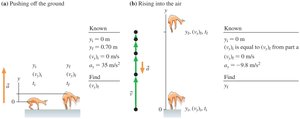
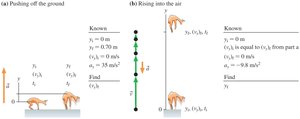
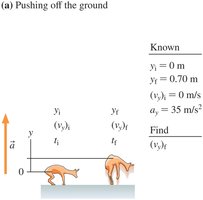
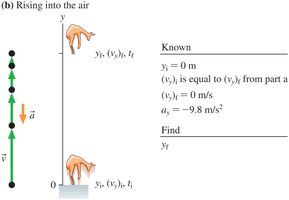
A springbok accelerates upward at over a displacement of 0.70 m, then rises into the air under gravity. To find the takeoff speed and maximum height:
Use for the push-off phase.
For the rise, use the same equation with and at the top.