 Indietro
Representing Motion and Vectors in Physics
Guida di studio - Note intelligenti
 Appunti personalizzati basati sui tuoi materiali, ampliati con definizioni chiave, esempi e contesto.
Representing Motion
Displacement and Position
In physics, displacement is a vector quantity that refers to the change in position of an object. The position of an object is its location relative to a chosen origin in a coordinate system. Displacement is represented by an arrow pointing from the starting position to the final position.
Displacement vector (\(\vec{d}\)): Shows both the distance and direction from the initial to the final position.
Position (x): The location of an object along a coordinate axis, which can be positive or negative depending on the chosen origin.
Example: If a car moves from position +4 miles to -5 miles, its displacement is -9 miles.
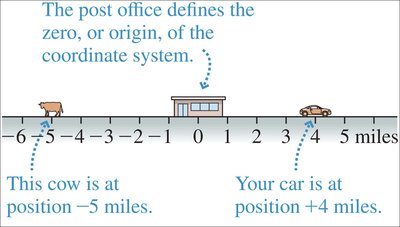
Describing Motion with Words
To describe motion, consider:
Starting position: Where does the motion begin?
Direction: In which direction is the object moving?
Stops: Does the object stop moving? When?
Turns: Does the object turn around? When?
Vectors and Vector Addition
Vector Representation
Vectors are quantities that have both magnitude and direction, such as displacement, velocity, and force. They are represented graphically by arrows.
Magnitude: The length of the arrow represents the size of the vector.
Direction: The direction of the arrow shows the direction of the vector.
Vector Addition
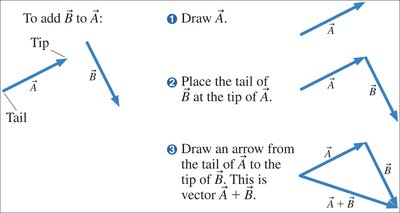
Vectors can be added graphically using the tip-to-tail method:
Draw the first vector (\(\vec{A}\)).
Place the tail of the second vector (\(\vec{B}\)) at the tip of the first vector.
Draw the resultant vector (\(\vec{A} + \vec{B}\)) from the tail of the first to the tip of the second.
Algebraically, if vectors are perpendicular, use the Pythagorean theorem:
For vectors at an angle \(\theta\):
Vector Addition in Context
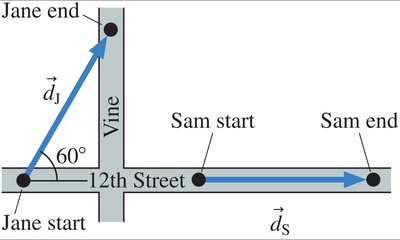
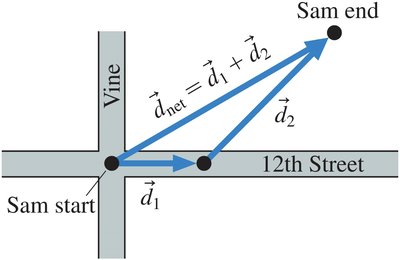
When adding displacement vectors in real-world scenarios, such as navigating city streets, use the tip-to-tail method and trigonometry to find the resultant displacement.
Trigonometry and Vectors
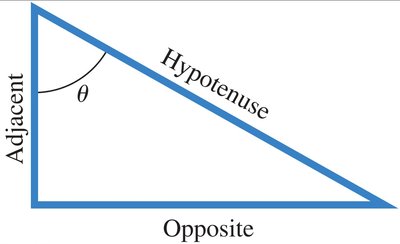
Trigonometry is essential for resolving vectors into components and for calculating the magnitude and direction of resultant vectors.
Sine, cosine, and tangent relate the sides of a right triangle to its angles:
Motion in One Dimension
Position vs. Time Graphs
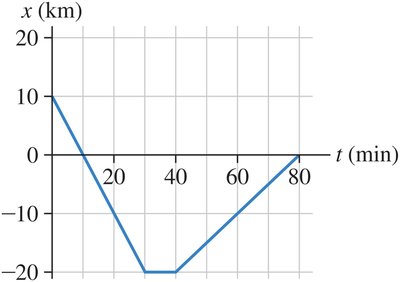
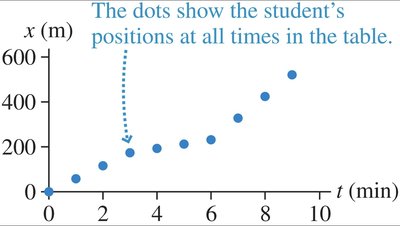
A position vs. time graph shows how an object's position changes over time. The slope of the graph represents the object's velocity.
Positive slope: Object moves in the positive direction.
Negative slope: Object moves in the negative direction.
Zero slope: Object is stationary.
Describing Motion from Graphs
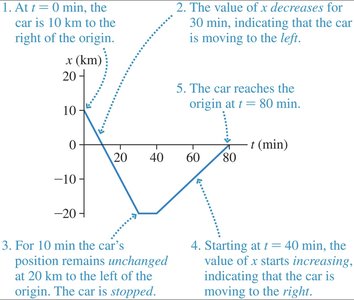
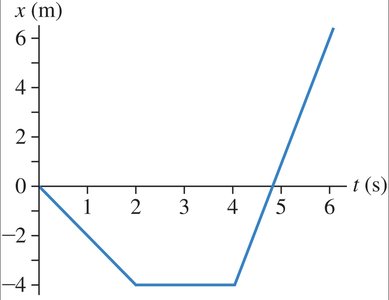
By analyzing position vs. time graphs, you can determine when an object is moving, stopped, or changing direction.
When the graph is flat, the object is stopped.
When the graph changes direction (slope changes sign), the object turns around.
Velocity and Acceleration
Velocity Vectors
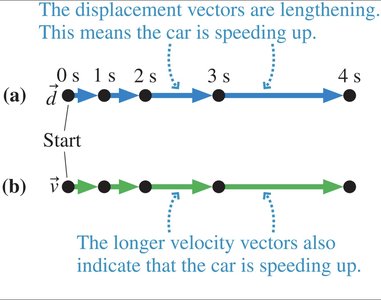
Velocity is a vector quantity that describes the rate of change of position. The direction of the velocity vector shows the direction of motion, and its length represents speed.
Average velocity:
Instantaneous velocity: The velocity at a specific moment in time.
Interpreting Velocity Diagrams
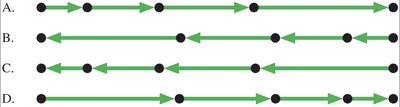
Velocity diagrams use arrows to represent the direction and magnitude of velocity at different times. Longer arrows indicate higher speeds.
Tabular and Graphical Data in Motion
Tabular Data: Position vs. Time
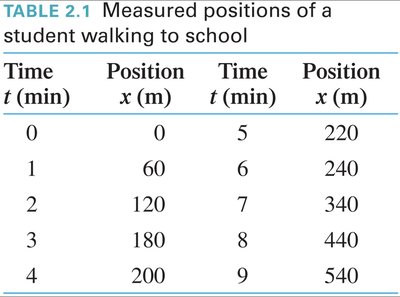
Motion can be described using tables that list position at various times. This data can be used to plot position vs. time graphs.
Time t (min) | Position x (m) | Time t (min) | Position x (m) |
|---|---|---|---|
0 | 0 | 5 | 220 |
1 | 60 | 6 | 240 |
2 | 120 | 7 | 340 |
3 | 180 | 8 | 440 |
4 | 200 | 9 | 540 |
Graphical Representation
Plotting the data from the table on a graph helps visualize how the position changes over time.
Summary Table: Key Concepts
Concept | Definition | Example |
|---|---|---|
Displacement | Change in position (vector) | Walking 3 m east, then 4 m north: displacement is 5 m northeast |
Velocity | Rate of change of position (vector) | Driving 60 km/h north |
Position vs. Time Graph | Graph showing position as a function of time | Line with positive slope: moving forward |
Vector Addition | Combining vectors using tip-to-tail or components | Adding wind velocity to airplane velocity |
