 Indietro
Acceleration and Kinematic Graphs in One-Dimensional Motion
Guida di studio - Note intelligenti
 Appunti personalizzati basati sui tuoi materiali, ampliati con definizioni chiave, esempi e contesto.
Acceleration and Kinematic Graphs
Introduction to Acceleration
Acceleration is a fundamental concept in kinematics, describing how the velocity of an object changes with time. In one-dimensional motion, understanding acceleration is essential for analyzing how objects move under various forces and conditions.
Position: The location of an object, typically given as a coordinate (e.g., x for horizontal position).
Velocity: The rate of change of position with respect to time; can be positive or negative depending on direction.
Acceleration: The rate of change of velocity with respect to time; can also be positive or negative.
Jerk: The rate of change of acceleration (not typically used in introductory physics courses).
Definitions and Calculus Formulation
Average Velocity:
Instantaneous Velocity:
Average Acceleration:
Instantaneous Acceleration:
Units: Velocity is measured in [m/s], and acceleration in [m/s2].

Constant Acceleration: Worked Examples
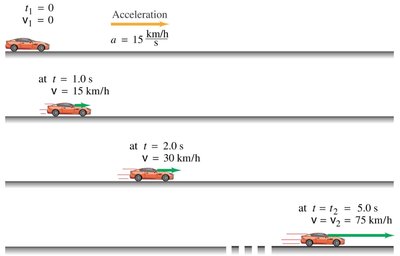
When acceleration is constant, the velocity of an object changes by equal amounts in equal time intervals. This is a common scenario in introductory physics problems.
For a car starting from rest with :
At :
At :
At :
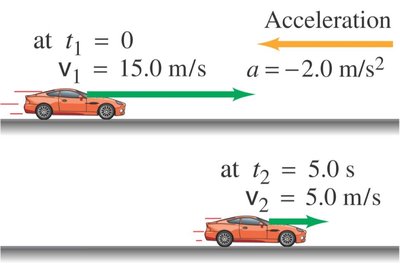
For a car decelerating with from to over :
Final velocity:
Clarifying Deceleration and Negative Acceleration
In everyday language, "deceleration" refers to any acceleration that reduces the speed of an object. However, in physics, negative acceleration simply means acceleration in the negative direction, which may or may not reduce speed depending on the direction of velocity.
Deceleration occurs when acceleration is opposite to the direction of velocity.
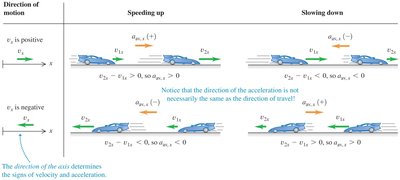
Negative acceleration is not always deceleration; it depends on the chosen coordinate system and direction of motion.
Signs of Velocity and Acceleration
The signs of velocity and acceleration are determined by the chosen coordinate system. Positive values indicate motion or acceleration in the positive direction, while negative values indicate the opposite.
Direction of Motion | Speeding Up | Slowing Down |
|---|---|---|
v is positive | a is positive (+) | a is negative (−) |
v is negative | a is negative (−) | a is positive (+) |
Graphical Interpretation of Acceleration
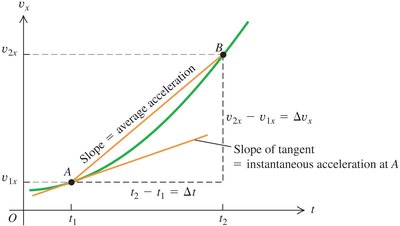
Acceleration can be interpreted as the slope of the velocity vs. time graph. The average acceleration over a time interval is the slope of the secant line, while the instantaneous acceleration at a point is the slope of the tangent line at that point.
For a velocity-time graph:
Average acceleration:
Instantaneous acceleration:
Kinematic Graphing Relationships
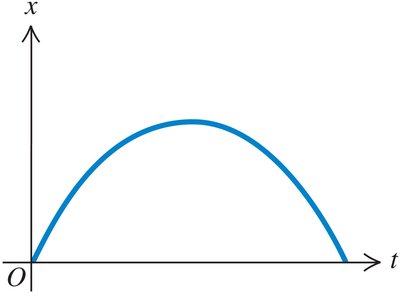
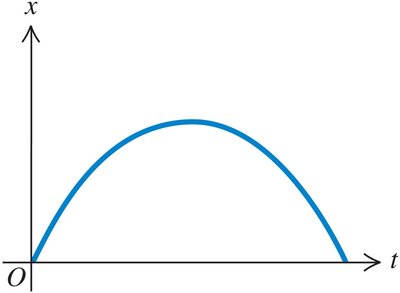
At all times , velocity is the slope of the vs. graph.
Over any interval , displacement is the net area under the vs. graph.
At all times , acceleration is the slope of the vs. graph.
Over any interval , change in velocity is the net area under the vs. graph.
Note: The net area method finds only changes (displacement or change in velocity), not initial values.
Review Quiz: Interpreting Kinematic Graphs
Students are often asked to interpret position vs. time and velocity vs. time graphs. Key questions include identifying when an object is at rest, when it reverses direction, and how its speed and acceleration change over time.
At points where the velocity graph crosses zero, the object is momentarily at rest.
The direction of travel reverses when velocity changes sign.
Acceleration is positive when the velocity graph slopes upward, negative when it slopes downward.
Summary Table: Kinematic Quantities and Their Graphical Relationships
Quantity | Graphical Representation | Mathematical Relationship |
|---|---|---|
Velocity | Slope of x vs. t | |
Displacement | Area under v vs. t | |
Acceleration | Slope of v vs. t | |
Change in Velocity | Area under a vs. t |
Additional info: In PHYS 151, calculus is introduced conceptually but not used for algebraic manipulation except in special cases. The focus is on understanding the relationships between position, velocity, and acceleration, and interpreting their graphical representations.
