 Indietro
Motion Along a Straight Line: Displacement, Velocity, and Speed
Guida di studio - Note intelligenti
 Appunti personalizzati basati sui tuoi materiali, ampliati con definizioni chiave, esempi e contesto.
Chapter 2: Motion Along a Straight Line
Overview and Goals
This chapter introduces the fundamental concepts of kinematics in one dimension, focusing on describing and analyzing straight-line motion using displacement, velocity, and speed. Students will learn to distinguish between average and instantaneous velocities, interpret position-time graphs, and solve related problems.
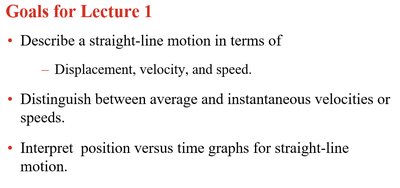
Describe straight-line motion in terms of displacement, velocity, and speed.
Distinguish between average and instantaneous velocities or speeds.
Interpret position versus time graphs for straight-line motion.
Kinematics: The Study of Motion
Introduction to Kinematics
Kinematics is the branch of physics that describes the motion of objects without considering the causes of motion. The primary physical quantities in kinematics are position, velocity, and acceleration.
Position: The location of an object at a particular time.
Velocity: The rate of change of position with respect to time.
Acceleration: The rate of change of velocity with respect to time.
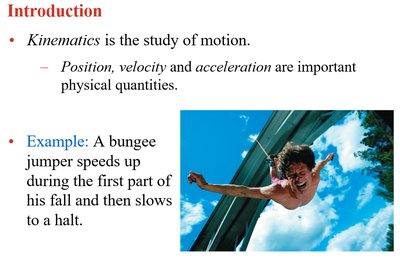
Example: A bungee jumper speeds up during the first part of his fall and then slows to a halt.
Displacement, Time, and Average Velocity
Definitions and Formulas
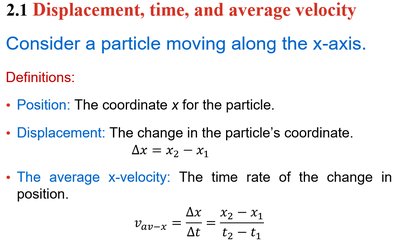
Consider a particle moving along the x-axis:
Position (x): The coordinate x for the particle.
Displacement (\( \Delta x \)): The change in the particle’s coordinate.
\( \Delta x = x_2 - x_1 \)
Average x-velocity (\( v_{av-x} \)): The time rate of change in position.
\( v_{av-x} = \frac{\Delta x}{\Delta t} = \frac{x_2 - x_1}{t_2 - t_1} \)
Worked Example: Positive Velocity
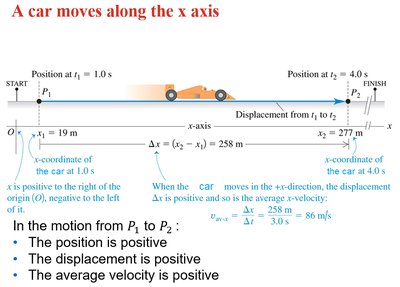
When a car moves along the x-axis from position \( P_1 \) to \( P_2 \):
The position is positive.
The displacement is positive.
The average velocity is positive.
For example, if \( x_1 = 19\,\text{m} \) at \( t_1 = 1.0\,\text{s} \) and \( x_2 = 277\,\text{m} \) at \( t_2 = 4.0\,\text{s} \):
\( \Delta x = 277 - 19 = 258\,\text{m} \)
\( \Delta t = 4.0 - 1.0 = 3.0\,\text{s} \)
\( v_{av-x} = \frac{258}{3.0} = 86\,\text{m/s} \)
Worked Example: Negative Velocity
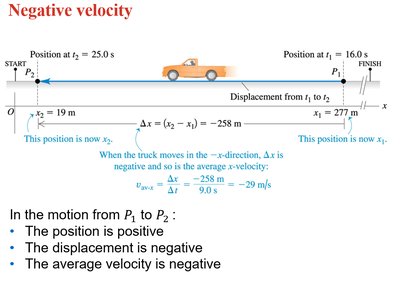
When a truck moves in the negative x-direction:
The position is positive.
The displacement is negative.
The average velocity is negative.
For example, if \( x_1 = 277\,\text{m} \) at \( t_1 = 16.0\,\text{s} \) and \( x_2 = 19\,\text{m} \) at \( t_2 = 25.0\,\text{s} \):
\( \Delta x = 19 - 277 = -258\,\text{m} \)
\( \Delta t = 25.0 - 16.0 = 9.0\,\text{s} \)
\( v_{av-x} = \frac{-258}{9.0} = -29\,\text{m/s} \)
Position-Time Graphs
Understanding x-t Graphs
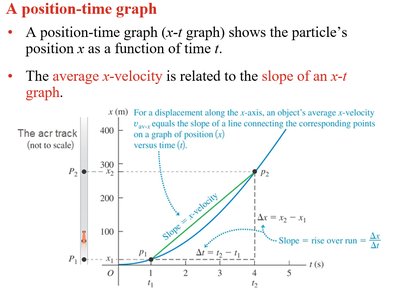
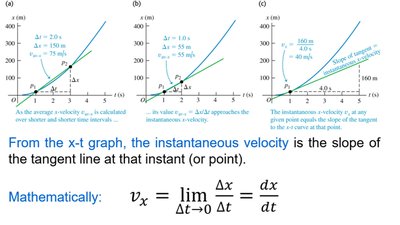
A position-time graph (x-t graph) shows the particle’s position x as a function of time t. The average x-velocity is related to the slope of an x-t graph:
The slope of the line connecting two points on the graph gives the average velocity over that interval.
For a displacement along the x-axis, the average x-velocity is:
\( v_{av-x} = \frac{\Delta x}{\Delta t} \)
Instantaneous Velocity in Straight-Line Motion
Definition and Calculation
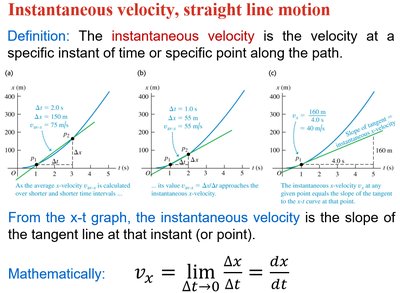
The instantaneous velocity is the velocity at a specific instant of time or specific point along the path. It is the slope of the tangent line at that instant on the x-t graph.
Mathematically, instantaneous velocity is defined as:
\( v_x = \lim_{\Delta t \to 0} \frac{\Delta x}{\Delta t} = \frac{dx}{dt} \)
Worked Example: Cheetah and Antelope
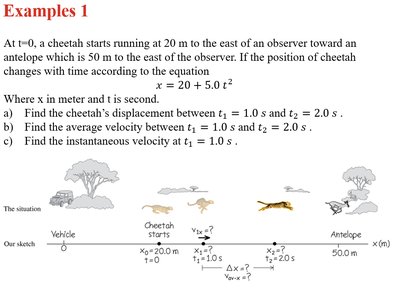
Example 1
At t = 0, a cheetah starts running at 20 m to the east of an observer toward an antelope which is 50 m to the east of the observer. If the position of the cheetah changes with time according to \( x = 20 + 5.0 t^2 \):
Find the cheetah’s displacement between \( t_1 = 1.0\,\text{s} \) and \( t_2 = 2.0\,\text{s} \).
Find the average velocity between \( t_1 = 1.0\,\text{s} \) and \( t_2 = 2.0\,\text{s} \).
Find the instantaneous velocity at \( t_1 = 1.0\,\text{s} \).
Motion Diagrams
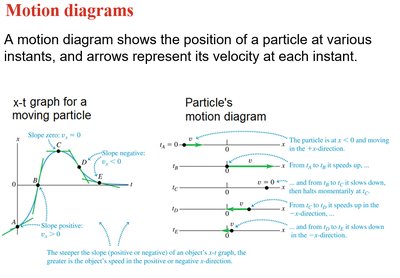
Visualizing Motion
A motion diagram shows the position of a particle at various instants, with arrows representing its velocity at each instant. The steeper the slope (positive or negative) of an object’s x-t graph, the greater the object’s speed in the positive or negative x-direction.
Distance and Displacement
Comparing Scalar and Vector Quantities
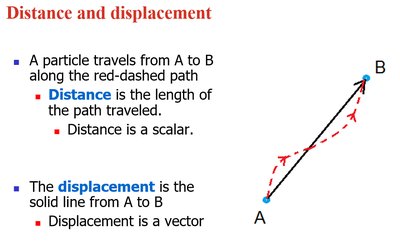
Distance is the length of the path traveled (scalar quantity).
Displacement is the straight-line distance from the initial to the final position (vector quantity).
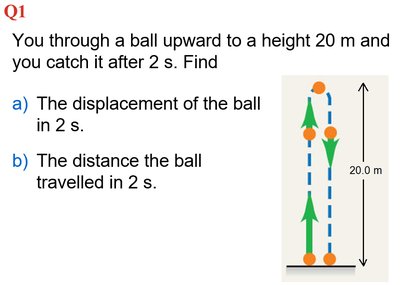
Worked Example: Ball Thrown Upward
You throw a ball upward to a height of 20 m and catch it after 2 s. Find:
The displacement of the ball in 2 s.
The distance the ball traveled in 2 s.
Speed and Velocity
Definitions and Relationships
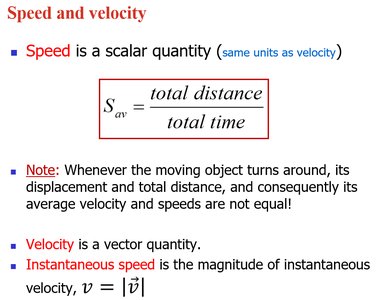
Speed is a scalar quantity (same units as velocity):
\( S_{av} = \frac{\text{total distance}}{\text{total time}} \)
Velocity is a vector quantity.
Instantaneous speed is the magnitude of instantaneous velocity: \( v = |\vec{v}| \)
When the moving object turns around, displacement and total distance differ, so average velocity and speed are not equal.
Worked Example: Position-Time Graph Analysis
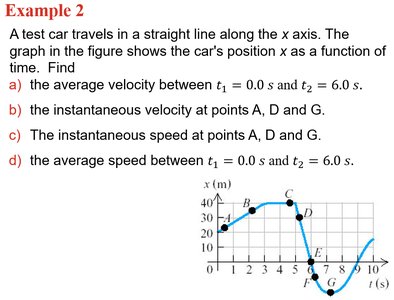
Example 2
A test car travels in a straight line along the x-axis. The graph shows the car’s position x as a function of time. Find:
The average velocity between \( t_1 = 0.0\,\text{s} \) and \( t_2 = 6.0\,\text{s} \).
The instantaneous velocity at points A, D, and G.
The instantaneous speed at points A, D, and G.
The average speed between \( t_1 = 0.0\,\text{s} \) and \( t_2 = 6.0\,\text{s} \).
Test Your Understanding: Conceptual and Quantitative Questions
Practice Problems
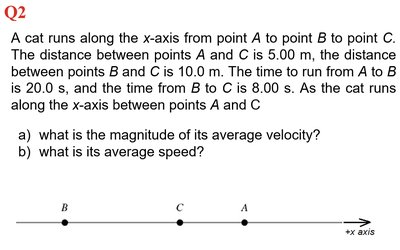
Q2: A cat runs along the x-axis from point A to B to C. Given distances and times, find the magnitude of average velocity and average speed.
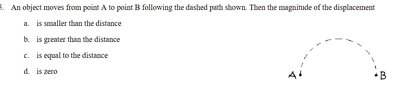
Multiple choice: Comparing displacement and distance for curved paths.
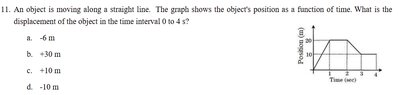
Graph interpretation: Find displacement from a position-time graph over a given interval.
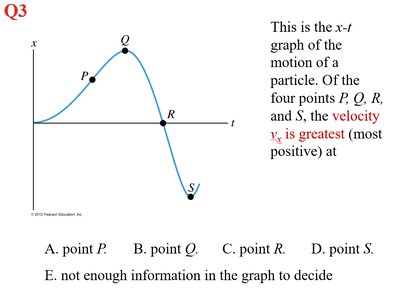
Q3: For an x-t graph, determine at which point the velocity is greatest (most positive).
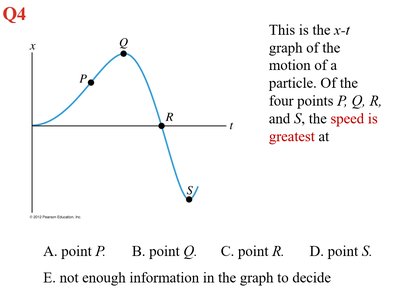
Q4: For an x-t graph, determine at which point the speed is greatest.
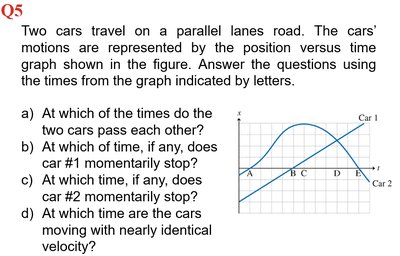
Q5: Two cars on parallel lanes—analyze position-time graphs to answer questions about passing, stopping, and identical velocities.
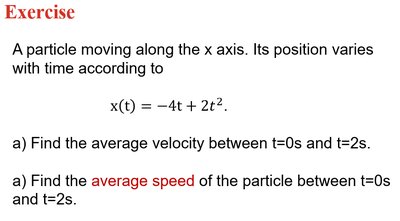
Exercise: For a particle with \( x(t) = -4t + 2t^2 \), find average velocity and average speed between t = 0 s and t = 2 s.
Additional info: These notes cover the core concepts of one-dimensional kinematics, including definitions, graphical analysis, and problem-solving strategies. The included examples and exercises reinforce the application of these concepts to real-world and theoretical scenarios.
