 Indietro
Motion in One Dimension: Physics with Calculus Study Notes
Guida di studio - Note intelligenti
 Appunti personalizzati basati sui tuoi materiali, ampliati con definizioni chiave, esempi e contesto.
Motion in One Dimension
Scalars and Vectors
In physics, quantities are classified as either scalars or vectors. Scalars have only magnitude, while vectors possess both magnitude and direction. Understanding this distinction is fundamental for analyzing motion.
Scalar: Examples include temperature, time, and mass.
Vector: Examples include velocity and displacement.
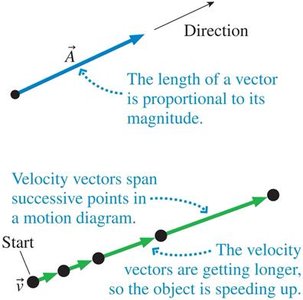
Vector Representation: The length of a vector arrow is proportional to its magnitude, and its direction indicates the vector's direction.
Motion Diagram: Velocity vectors span successive points, and increasing vector length indicates speeding up.
Describing Position and Displacement
Position locates an object relative to a coordinate system. Displacement is the change in position, and it is a vector quantity.
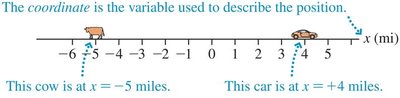
Position: Described by a coordinate (e.g., x or y).
Displacement: (signed quantity for motion along a line).
Coordinate System: The variable used to describe position; positive and negative values indicate direction relative to the origin.
Time and Velocity
Time is measured from a reference instant (t = 0). The time interval is the difference between two instants. Velocity is the ratio of displacement to time interval.
Time Interval:
Velocity:
Direction: The sign of velocity indicates direction of motion.
Units and Scientific Notation
Measurements must include units. The SI system is standard in science.
Length: meters (m)
Time: seconds (s)
Mass: kilograms (kg)
Scientific Notation: Used for expressing large or small numbers.
Unit Conversion: Multiplying by conversion factors to change units.
Significant Figures and Order-of-Magnitude Estimates
Significant figures reflect the precision of measurements. Order-of-magnitude estimates are rough calculations, typically accurate to one significant figure.
Multiplication/Division: Result has the fewest significant figures.
Addition/Subtraction: Result has the fewest decimal places.
Order-of-Magnitude: Useful for quick, approximate calculations.
Analyzing Motion: Diagrams and Graphs
Motion Diagrams
Motion diagrams mark the position of an object at successive times. They are a visual tool for analyzing motion.
Successive Positions: Each dot represents the object's location at a specific time.
Velocity Vectors: Arrows indicate direction and speed.

Position vs. Time Graphs
Position-versus-time graphs are fundamental for understanding motion. The slope of the graph at any point gives the velocity.
Slope: Steeper slope means faster speed.
Direction: Positive slope = motion to the right/up; negative slope = motion to the left/down.
Velocity:
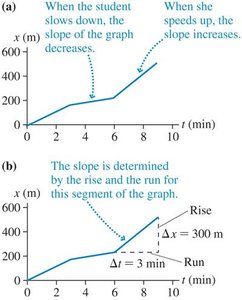
Interpreting Position-Versus-Time Graphs
Key information about motion can be extracted from position-versus-time graphs:
Read position at a given time.
Find velocity by calculating the slope.
Determine direction from the sign of the slope.
Velocity vs. Time Graphs
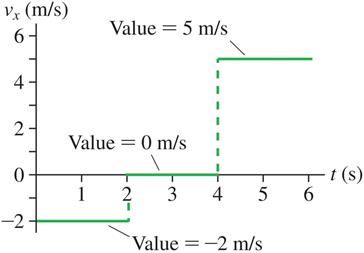
Velocity-versus-time graphs provide another representation of motion. The area under the curve gives displacement.
Constant Velocity: Horizontal line.
Changing Velocity: Sloped or curved line.
Displacement: Area under the velocity curve.
Uniform Motion
Definition and Characteristics
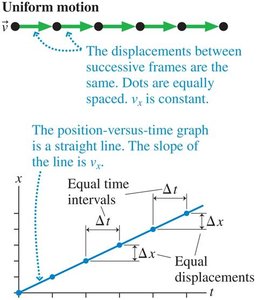
Uniform motion is straight-line motion where equal displacements occur during equal time intervals. The position-versus-time graph is a straight line.
Constant Velocity: is constant.
Position Equation:
Proportional Relationships
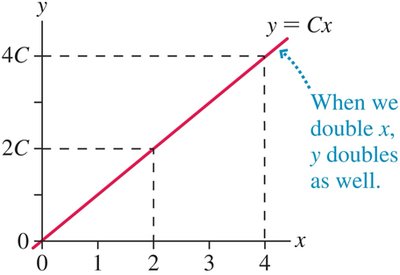
Many physical quantities are proportional. If , doubling doubles .
Proportionality Constant:
Scaling: Ratio reasoning allows solving problems without knowing .
Example: Ratio Reasoning in Uniform Motion
If a train travels 12 km in 10 minutes, it will take 50 minutes to travel 60 km, since distance and time are proportional in uniform motion.
Ratio:
Time: minutes
Instantaneous Velocity
Definition and Calculation
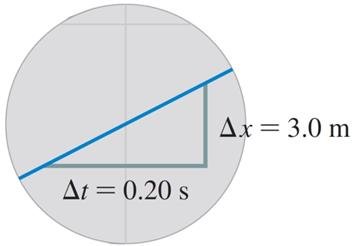
Instantaneous velocity is the velocity at a specific instant. It is found by calculating the slope of the tangent to the position-versus-time curve at that point.
Instantaneous Velocity:
Tangent Line: Slope of tangent equals instantaneous velocity.
Acceleration
Definition and Units
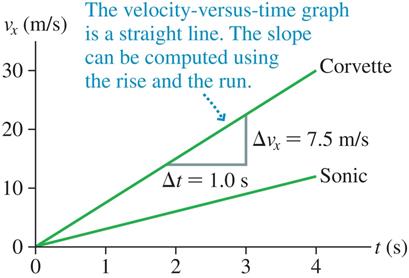
Acceleration describes how velocity changes with time. It is the slope of the velocity-versus-time graph.
Acceleration:
SI Units: meters per second squared (m/s2)
Sign of Acceleration
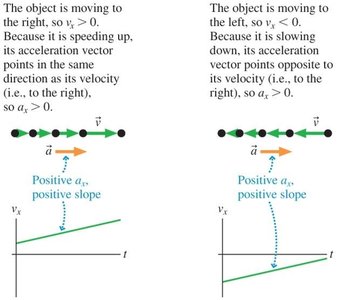
Acceleration is a vector. In one dimension, if an object is speeding up, velocity and acceleration have the same sign; if slowing down, they have opposite signs.
Positive Acceleration: Points right/up.
Negative Acceleration: Points left/down.
Motion with Constant Acceleration
Kinematic Equations
For constant acceleration, the following equations describe motion:
Velocity:
Position:
Velocity-Displacement:
Quadratic Relationships
When displacement is proportional to the square of time, the graph is a parabola. Changing time by a factor changes displacement by the square of that factor.
Quadratic Relationship:
Scaling: If increases by 2, increases by 4.
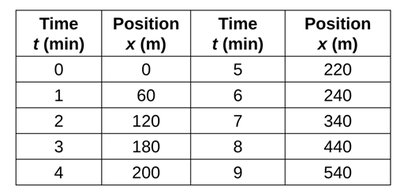
Summary Table: Measured Positions of a Student Walking to School
Time t (min) | Position x (m) | Time t (min) | Position x (m) |
|---|---|---|---|
0 | 0 | 5 | 220 |
1 | 60 | 6 | 240 |
2 | 120 | 7 | 340 |
3 | 180 | 8 | 440 |
4 | 200 | 9 | 540 |
Summary of Key Concepts
Velocity: Rate of change of position.
Acceleration: Rate of change of velocity.
Position vs. Time Graph: Slope gives velocity.
Velocity vs. Time Graph: Slope gives acceleration; area under curve gives displacement.
Uniform Motion: Constant velocity; linear position graph.
Constant Acceleration: Linear velocity graph; parabolic position graph.
Additional info: Academic context and explanations have been expanded for clarity and completeness. Only directly relevant images and tables have been included to reinforce key concepts.
