 Indietro
Motion in One Dimension: Position, Displacement, and Velocity
Guida di studio - Note intelligenti
 Appunti personalizzati basati sui tuoi materiali, ampliati con definizioni chiave, esempi e contesto.
Motion in One Dimension
Introduction to 1D Motion
Motion in one dimension (1D) is a foundational concept in physics, describing how objects move along a straight line. Understanding 1D motion involves analyzing position, displacement, and velocity, and interpreting these quantities through equations, graphs, and motion maps.
Position and Displacement
Position is the location of an object at a specific time, denoted as . Displacement is the change in position over a time interval, represented as . These concepts are essential for describing how far and in which direction an object has moved.
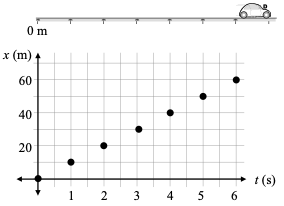
Position (): The value on the vertical axis of a position-time graph indicates the object's location at a given time.
Displacement (): The difference in position between two times, , shows how far the object has traveled.
Direction: Displacement is a vector; its sign indicates direction (positive or negative along the axis).
Example: If a car moves from m to m, its displacement is m.
Interpreting Position-Time Graphs
Position-time graphs are powerful tools for visualizing motion. The value on the y-axis gives the position, while the change over an interval gives displacement. The slope of the graph represents velocity.
Key Features: The slope of the line connecting points indicates the rate of change of position (velocity).
Intervals: Quantities change over intervals, typically time intervals ().
Velocity
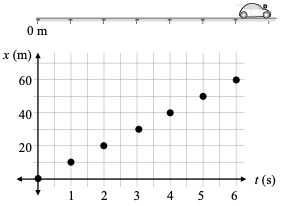
Velocity is the rate of change of position with respect to time. It is a vector quantity, meaning it has both magnitude and direction. The average velocity over a time interval is given by:
Formula:
Interpretation: The slope of a position-time graph gives the velocity.
Significance: Positive velocity indicates motion in the positive direction; negative velocity indicates motion in the opposite direction.
Example: If a car's displacement is 30 m over 3 s, its velocity is .
Average and Instantaneous Velocity
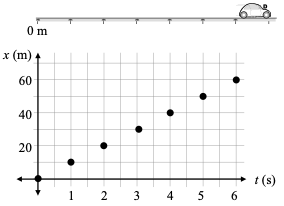
Average velocity is calculated over a finite time interval, while instantaneous velocity is the rate of change of position at a specific moment.
Average Velocity:
Instantaneous Velocity:
Graphical Interpretation: The instantaneous velocity is the slope of the tangent to the position-time curve at a given point.
Example: On a position-time graph, the steepest slope corresponds to the highest instantaneous velocity.
Signs of Displacement and Velocity
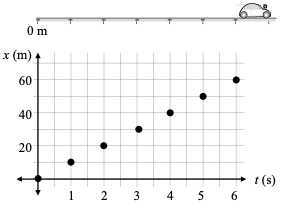
Both displacement and velocity are vector quantities. The sign of these values indicates the direction of motion. Positive values correspond to movement in one direction, negative values in the opposite direction.
Displacement:
Velocity:
Direction: The sign tells you which way the object is moving.


Position and Velocity Relationship
Velocity describes how position changes over time. Position is the accumulation of displacement, and can be calculated using the initial position, velocity, and time interval:
Formula:
Graphical Representation: The area under a velocity-time graph gives the displacement.
Example: If a car starts at 0 m and moves at 10 m/s for 5 s, its final position is m.


Core Physics Ideas
Quantities change over intervals: Most physical quantities are measured as changes over intervals (time or position).
Rate of Change: The rate of change is a fundamental concept, relating how one quantity varies with another.
Mathematical Representation:
Applications: Predator-Prey Models
Real-world motion, such as predator-prey interactions, can be analyzed using the concepts of position, displacement, and velocity. For example, the strategies of lions and their prey involve understanding how quickly and in what direction each moves.

Example: The velocity and displacement of both predator and prey can be measured and compared to understand escape and capture strategies.
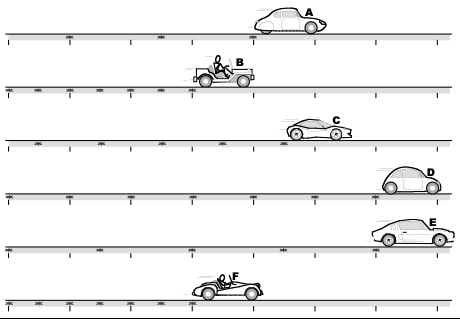
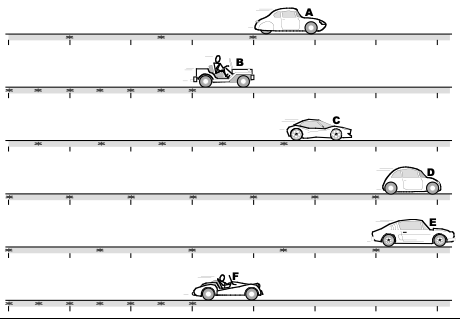
Motion Maps and Fastness Index
Motion maps visually represent the positions of multiple objects over time, helping to compare their velocities and displacements. The Fastness Index is a comparative measure of how quickly different objects move.
Motion Map: Shows the positions of objects at regular time intervals.
Fastness Index: Calculated by comparing the displacement and time intervals for each object.
Summary Table: Position, Displacement, and Velocity
Quantity | Definition | Formula | Vector/Scalar |
|---|---|---|---|
Position () | Location at a specific time | Scalar | |
Displacement () | Change in position | Vector | |
Velocity () | Rate of change of position | Vector | |
Average Velocity () | Average rate of change over interval | Vector | |
Instantaneous Velocity () | Rate at a specific moment | Vector |
Additional info: The notes expand on the brief lecture points by providing definitions, formulas, and examples, ensuring a self-contained study guide suitable for exam preparation in Physics with Calculus.
