 Indietro
One-Dimensional Kinematics: Position, Displacement, Velocity, and Acceleration
Guida di studio - Note intelligenti
 Appunti personalizzati basati sui tuoi materiali, ampliati con definizioni chiave, esempi e contesto.
One-Dimensional Kinematics
Position, Displacement, and Distance
To analyze the motion of an object in one dimension, a coordinate system is established, typically along the x-axis. The origin and positive direction must be specified to describe the location and movement of objects.
Position (x): The location of an object relative to the origin. SI unit: meter (m). Position is a vector quantity.
Displacement (Δx): The change in position, defined as final position minus initial position. SI unit: meter (m). Displacement is a vector quantity.
Distance: The total length of the path traveled. SI unit: meter (m). Distance is a scalar quantity and always positive.
Key distinction: Displacement depends only on initial and final positions, not the path taken. Distance measures the actual path length.
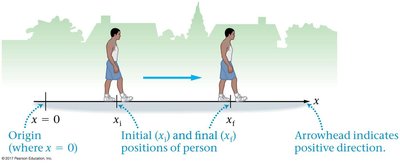
Additional info: In higher dimensions, displacement is defined using vector notation: .
Worked Examples: Displacement and Distance
Examples help clarify the concepts of position, displacement, and distance using real-world scenarios.
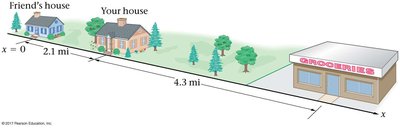
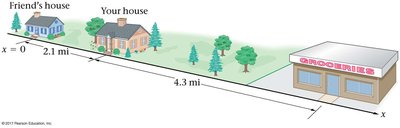
Example 1: Walking from your house to your friend's house (2.1 mi down the road). - Initial position: - Final position: mi - Displacement: mi - Distance: 2.1 mi
Example 2: Walking to the grocery store (4.3 mi up the road) and returning home. - Initial position: mi - Final position: mi - Displacement: mi - Distance: mi (to store) + mi (back) = mi
Average Speed and Average Velocity
Average speed and average velocity are measures of how rapidly an object moves, but they differ in their definitions and physical meaning.
Average Velocity: Displacement divided by elapsed time. Vector quantity.
Average Speed: Distance divided by elapsed time. Scalar quantity.
Direction: The sign of average velocity indicates direction (positive for motion in positive x-direction, negative for negative x-direction).
Note: Average speed is always positive; average velocity can be positive or negative.
Position-Time Graphs and Average Velocity
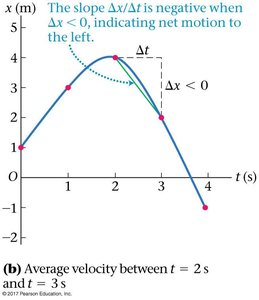
Position versus time graphs are powerful tools for visualizing motion. The slope of a line connecting two points on such a graph represents the average velocity over that interval.
Slope:
Interpretation: Positive slope indicates motion in the positive direction; negative slope indicates motion in the negative direction.
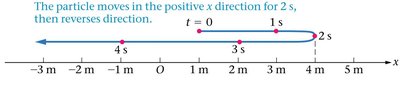
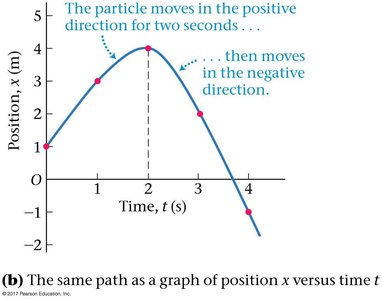
Examples: Calculating Average Velocity
Worked examples demonstrate how to calculate average velocity from position-time data.
Example 1: Average velocity from s to s.
Example 2: Average velocity from s to s.
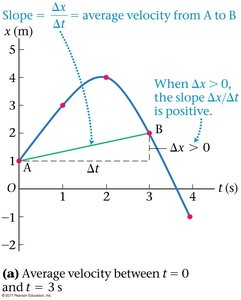
Example: Average Speed vs Average Velocity
A sprinter runs 100 m in 10 s, then jogs back 150 m in 40 s. Calculating both average speed and average velocity illustrates their differences.
Total distance:
Average speed:
Displacement: (final position is 50 m left of origin)
Average velocity:
Instantaneous Velocity
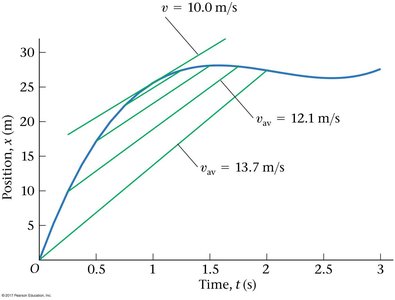
Instantaneous velocity is the velocity of an object at a specific instant. It is defined as the limit of average velocity as the time interval approaches zero.
Definition:
Graphical interpretation: The instantaneous velocity at a given time is the slope of the tangent line at that point on a position vs time graph.
Instantaneous speed: The magnitude of instantaneous velocity (scalar).
Acceleration
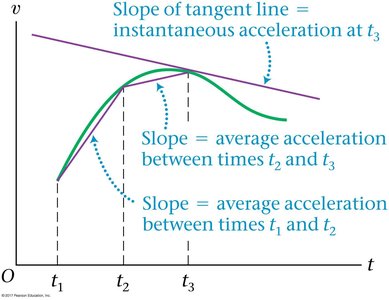
Acceleration is the rate of change of velocity with respect to time. It is a vector quantity and can be average or instantaneous.
Average acceleration:
Instantaneous acceleration:
SI unit: meter per second squared (m/s2)
Example: Calculating Average Acceleration
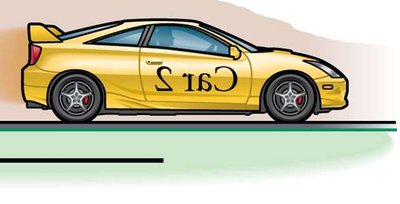
An electric sportscar accelerates from rest to 100 km/h in 2.6 s. The average acceleration is calculated as follows:
Convert 100 km/h to m/s:
Average acceleration:
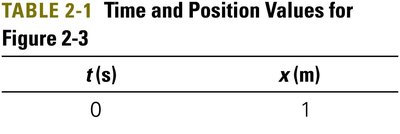
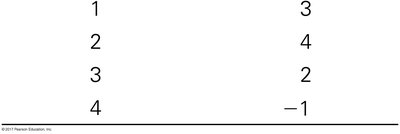
Summary Table: Time and Position Values
The following table summarizes time and position values for a sample motion:
t (s) | x (m) |
|---|---|
0 | 1 |
1 | 3 |
2 | 4 |
3 | 2 |
4 | -1 |
Additional info: This table is used to plot position vs time graphs and calculate average velocities for different intervals.
