 Indietro
Physics with Calculus: Motion, Vectors, and Measurement Fundamentals
Guida di studio - Note intelligenti
 Appunti personalizzati basati sui tuoi materiali, ampliati con definizioni chiave, esempi e contesto.
Representing Motion
Position and Coordinate Systems
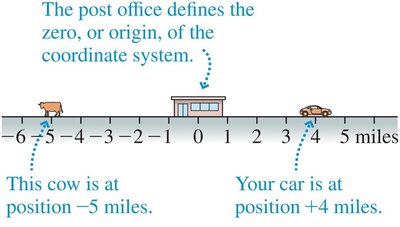
To describe the position of an object, a reference point (origin), a distance from the origin, and a direction are required. The combination of an origin and an axis marked in both positive and negative directions forms a coordinate system.
Position: The location of an object relative to a reference point.
Coordinate System: Used to specify positions in space.
Origin: The reference point from which positions are measured.
Direction: Indicates whether the position is positive or negative relative to the origin.
Example: A cow at -5 miles and a car at +4 miles relative to a post office origin.
Time in Motion Diagrams
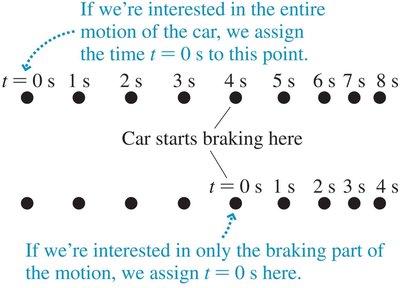
Each frame in a motion diagram is labeled with its corresponding time, denoted by the symbol t. Assigning t = 0 to a specific event helps analyze motion segments.
Motion Diagram: Represents an object's position at successive times.
Time Assignment: Can be set to different events for focused analysis.
Describing Motion
Velocity and Speed
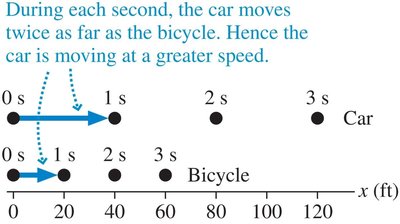
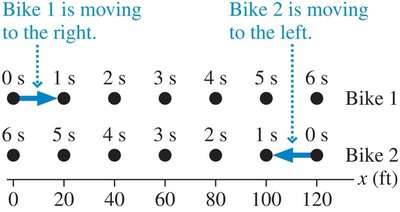
Uniform motion is movement at a constant speed in a straight line. Speed measures how fast an object moves, while velocity includes both speed and direction.
Speed: Scalar quantity; only magnitude.
Velocity: Vector quantity; magnitude and direction.
Average Velocity: Defined as the change in position divided by the change in time.
Formula:
Measurement and Units
Significant Figures
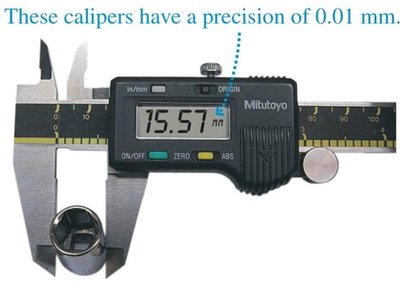
Measurements are limited by precision, and significant figures indicate the digits reliably known. Calculations must respect the precision of the least precise measurement.
Multiplication/Division: Answer has the same number of significant figures as the least precise input.
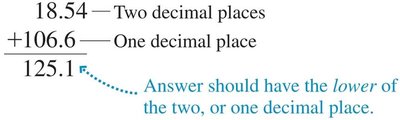
Addition/Subtraction: Answer has the same number of decimal places as the least precise input.
Exact Numbers: Do not affect significant figures.

Scientific Notation
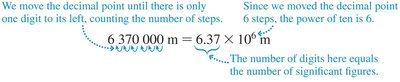
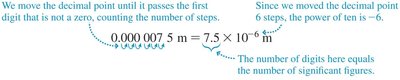
Scientific notation simplifies the expression of very large or small numbers and clarifies the number of significant figures.
Large Numbers: Move decimal left, multiply by .
Small Numbers: Move decimal right, multiply by .
Example: Earth's radius
SI Units and Unit Conversion
The International System of Units (SI) is used for scientific measurements. Unit conversions are essential for consistency.
SI Units: Second (s), meter (m), kilogram (kg).
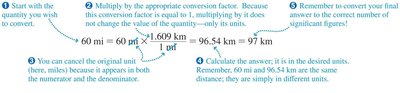
Unit Conversion: Multiply by conversion factors to change units.
Example:
Order-of-Magnitude Estimation
Order-of-magnitude estimates use one significant figure and are indicated by the symbol for less precision than .
Quantity | SI Unit | Approximate Conversion |
|---|---|---|
Mass | kg | 1 kg 2 lb |
Length | m | 1 m 3 ft |
Length | cm | 3 cm 1 in |
Length | km | 5 km 3 mi |
Speed | m/s | 1 m/s 2 mph |
Speed | km/h | 10 km/h 6 mph |
Vectors and Motion: A First Look
Scalars and Vectors
Physical quantities are classified as scalars or vectors. Scalars have only magnitude, while vectors have both magnitude and direction.
Scalar: Single number with unit (e.g., mass, temperature).
Vector: Magnitude and direction (e.g., velocity, displacement).
Magnitude: Length of the vector.
Graphical Representation: Arrow with length proportional to magnitude.

Displacement Vectors
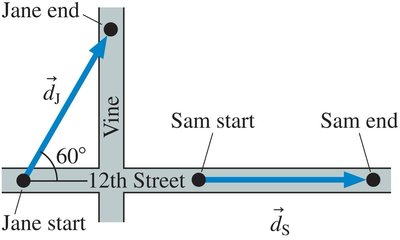
The displacement vector shows the distance and direction of an object's motion, drawn from the initial to the final position regardless of the path taken.
Displacement: Vector from start to end position.
Path Independence: Only initial and final positions matter.
Adding Vectors
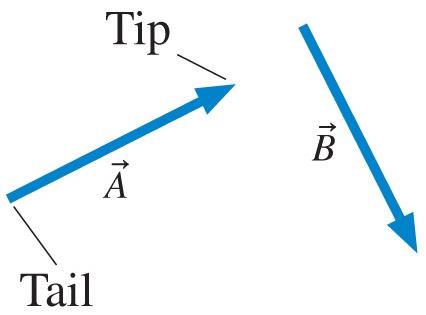
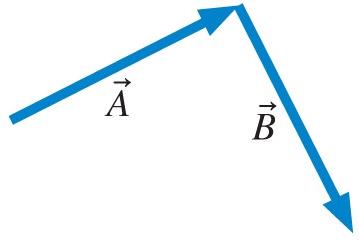
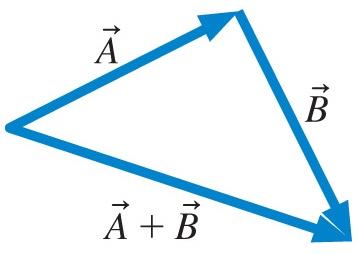
Vectors are added graphically by placing the tail of one at the tip of the other. The resultant vector is drawn from the tail of the first to the tip of the second.
Step 1: Draw vector A.
Step 2: Place tail of B at tip of A.
Step 3: Draw resultant vector from tail of A to tip of B.

Vectors and Trigonometry
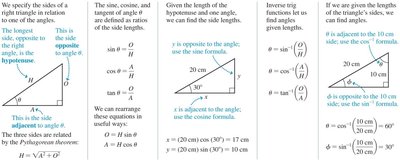
Trigonometry is used to calculate lengths and angles in triangles, which is essential for analyzing vectors.
Sine, Cosine, Tangent: Ratios of sides in a right triangle.
Pythagorean Theorem:
Inverse Functions: Used to find angles from side lengths.
Example: Displacement Calculation
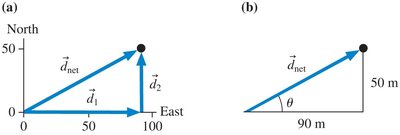
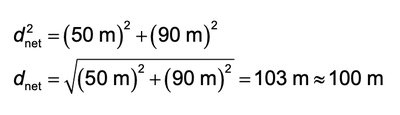
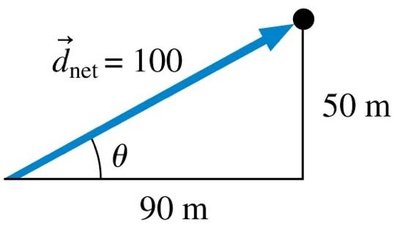
Anna walks 90 m east and 50 m north. Her net displacement is found using vector addition and the Pythagorean theorem.
Draw vectors tip-to-tail.
Net displacement: Hypotenuse of right triangle.
Magnitude:
Direction:
Velocity Vectors
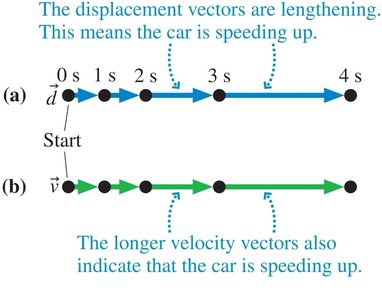
Velocity is represented as a vector pointing in the direction of motion, with magnitude equal to speed.
Velocity Vector: Indicates both speed and direction.
Motion in One Dimension
Uniform Motion
Uniform motion is straight-line motion with constant velocity. The position-versus-time graph is a straight line.
Constant Velocity: Equal displacements in equal time intervals.
Position Graph: Linear for uniform motion.
Equations of Uniform Motion
The displacement is proportional to the time interval, and the relationship is given by:
Equation:
Proportional Relationships
Many physical relationships are proportional, meaning one variable changes by the same factor as another.
General Form:
Scaling: If doubles, doubles.
Ratio Reasoning: Useful for solving problems without knowing .
Graphical Analysis of Motion
Position vs Time Graphs
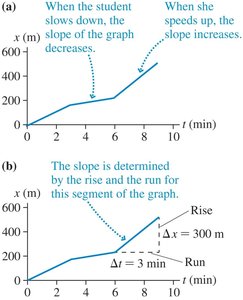
Position-versus-time graphs plot position on the vertical axis and time on the horizontal axis. The slope indicates velocity.
Steeper Slope: Faster speed.
Positive Slope: Motion to the right/up.
Negative Slope: Motion to the left/down.
Velocity vs Time Graphs
Velocity-versus-time graphs plot velocity on the vertical axis and time on the horizontal axis. The area under the curve represents displacement.
Area Under Curve: Equals displacement.
Sign of Velocity: Indicates direction of motion.
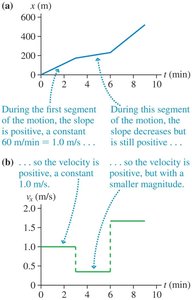
Interpreting Graphs
Key information about motion can be obtained from position-versus-time graphs:
Read position at a given time.
Find velocity by slope.
Determine direction by sign of slope.
Instantaneous Velocity
Definition and Calculation
Instantaneous velocity is the velocity at a specific instant. It is found by calculating the slope of the tangent to the position-versus-time curve at that point.
Instantaneous Velocity:
Graphical Method: Slope of tangent line at a point.
Displacement from Velocity Graphs
For non-uniform motion, the area under the velocity-versus-time graph gives the displacement.
Area Calculation: For straight lines, use geometric formulas (e.g., triangle area).
Summary Table: Common SI Units
Quantity | Unit | Abbreviation |
|---|---|---|
Time | Second | s |
Length | Meter | m |
Mass | Kilogram | kg |
Summary Table: Approximate Conversion Factors
Quantity | SI Unit | Approximate Conversion |
|---|---|---|
Mass | kg | 1 kg ≈ 2 lb |
Length | m | 1 m ≈ 3 ft |
Length | cm | 3 cm ≈ 1 in |
Length | km | 5 km ≈ 3 mi |
Speed | m/s | 1 m/s ≈ 2 mph |
Speed | km/h | 10 km/h ≈ 6 mph |
Additional info: These notes cover foundational concepts in motion, measurement, and vector analysis, suitable for Physics with Calculus students. All images included directly reinforce the adjacent explanations and are strictly relevant to the content.
