 Indietro
Representing Motion: Position, Velocity, and Acceleration in One Dimension
Guida di studio - Note intelligenti
 Appunti personalizzati basati sui tuoi materiali, ampliati con definizioni chiave, esempi e contesto.
Representing Motion
Coordinate Systems and Position
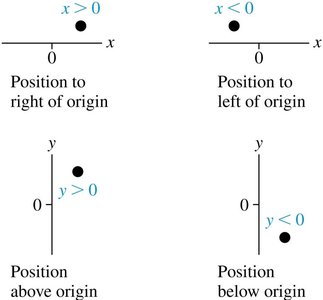
To analyze motion, we use coordinate axes to define positions in space. The x-axis is typically used for horizontal motion (positive to the right), and the y-axis for vertical motion (positive upward). The choice of axes is flexible, but must be clearly indicated in your work.
Position is the location of an object relative to an origin (0 point) on the chosen axis.
Positions to the right (x > 0) or above (y > 0) the origin are positive; to the left (x < 0) or below (y < 0) are negative.
Motion Diagrams
A motion diagram visually represents an object's position at successive time intervals. Each dot marks the object's location at a specific time, and arrows indicate direction and relative speed.
Equally spaced dots: constant velocity.
Increasing spacing: speeding up.
Decreasing spacing: slowing down.

Position vs. Time Graphs
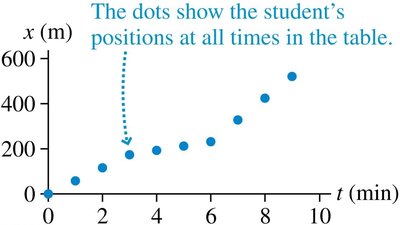
A position-versus-time graph plots an object's position (x) on the vertical axis against time (t) on the horizontal axis. This graph provides a visual summary of how position changes over time.
The slope of the graph at any point indicates the object's velocity.
Straight lines: constant velocity.
Curved lines: changing velocity (acceleration).
From Position to Velocity
Understanding Slope and Velocity
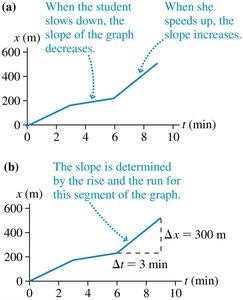
The slope of a position-versus-time graph is a key concept in kinematics. It tells us how quickly position changes with time, which is the definition of velocity.
Average velocity () is the total displacement divided by the total time interval:
Velocity is a vector (it has both magnitude and direction).
SI units: meters per second (m/s).
Graphical Interpretation
On a position-time graph:
A steeper slope means a higher speed.
A positive slope means motion in the positive direction; a negative slope means motion in the negative direction.
Horizontal segments (slope = 0) indicate the object is at rest.

Worked Example: Calculating Velocity from a Graph
Given a position vs. time graph, the velocity at a specific time is the slope at that point. For example, if a skateboard's position changes from 0 m to 10 m in 4 seconds, the average velocity is:
Negative slopes indicate negative velocity (motion in the opposite direction).
Analyzing Position vs. Time Graphs
Key Features and Interpretation
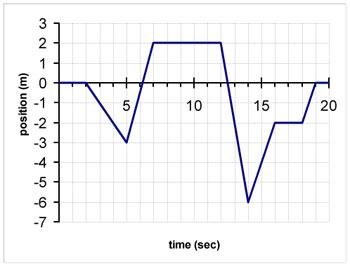
Above the x-axis: positive position.
Below the x-axis: negative position.
Straight line: constant velocity.
Curved line: changing velocity (acceleration).
Points where the graph is flat (slope = 0): object is at rest.
Summary Table: Reading Position vs. Time Graphs
Graph Feature | Physical Meaning |
|---|---|
Above x-axis | Positive position |
Below x-axis | Negative position |
Straight line | Constant velocity |
Horizontal line | At rest |
Curved line | Changing velocity (acceleration) |
From Position to Velocity: Velocity-Time Graphs
Constructing Velocity-Time Graphs
A velocity-versus-time graph can be deduced from the slope of the position-versus-time graph. It provides another way to represent an object's motion.
Constant velocity: horizontal line.
Changing velocity: sloped or curved line.

Example: Matching Motion Diagrams and Velocity Graphs
Given a motion diagram, the corresponding velocity-time graph shows how the object's speed and direction change over time.

From Velocity to Position: Area Under the Curve
Displacement from Velocity-Time Graphs
The displacement () of an object is equal to the area under the velocity-time graph during a given time interval ():
For constant velocity, this area is a rectangle: .
For changing velocity, sum the areas of geometric shapes under the curve.
Instantaneous Velocity
Definition and Calculation
Instantaneous velocity is the velocity of an object at a specific instant in time. It is found as the slope of the tangent to the position-time curve at that point.
For a curve , the instantaneous velocity at time is:
Graphically, draw a tangent line at the point of interest and calculate its slope.
Velocity Changing with Time: Acceleration
Average and Instantaneous Acceleration
Acceleration describes how velocity changes with time. The average acceleration () is given by:
Acceleration is a vector (direction matters).
SI units: meters per second squared (m/s2).
"Speeding up" or "slowing down" depends on the direction of velocity and acceleration.
Worked Example: Lion's Acceleration
A lion accelerates from rest () at to . The time required is:
Worked Example: Skater with Constant Acceleration
A skater moves east at and experiences a constant acceleration of westward. To find the final velocity after :
After , (now moving west).
Plotting velocity vs. time and position vs. time graphs helps visualize the motion and identify intervals of speeding up or slowing down.
Summary Table: Key Kinematic Quantities
Quantity | Definition | SI Unit |
|---|---|---|
Position () | Location relative to origin | meter (m) |
Displacement () | Change in position | meter (m) |
Velocity () | Rate of change of position | meter/second (m/s) |
Acceleration () | Rate of change of velocity | meter/second2 (m/s2) |
