 Indietro
Study Guide: Motion Along a Straight Line – Graphs, Velocity, and Acceleration
Guida di studio - Note intelligenti
 Appunti personalizzati basati sui tuoi materiali, ampliati con definizioni chiave, esempi e contesto.
Q1. During which trial(s) is the object's velocity not constant?
Background
Topic: Interpreting Position vs. Time Graphs
This question tests your ability to analyze position versus time graphs and determine when an object's velocity is not constant. A changing slope on a position-time graph indicates changing velocity (acceleration).
Key Terms and Formulas:
Velocity: The rate of change of position with respect to time. On a position vs. time graph, velocity is the slope of the curve.
Constant Velocity: Represented by a straight line (constant slope) on a position vs. time graph.
Changing Velocity: Indicated by a curve (changing slope) on a position vs. time graph.
Step-by-Step Guidance
Examine each trial's position vs. time graph and observe the shape of the line.
Identify which trial(s) have a straight line (constant slope) and which have a curve (changing slope).
Recall that a changing slope means the velocity is not constant (the object is accelerating or decelerating).
List the trial(s) where the slope is not constant. Do not state the final answer yet.
Try solving on your own before revealing the answer!
Final Answer:
The object's velocity is not constant during Trial B. The graph for Trial B has a changing slope, indicating non-constant velocity. All other trials have straight lines (constant slope), corresponding to constant velocity.
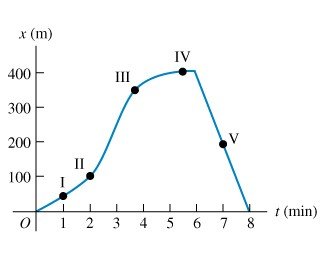
Q2. At which of the labeled points is the professor's velocity zero?
Background
Topic: Velocity from Position vs. Time Graphs
This question asks you to identify where the instantaneous velocity is zero by analyzing a position vs. time graph. Velocity is zero where the graph has a horizontal tangent (flat spot).
Key Terms and Formulas:
Instantaneous Velocity: The slope of the tangent to the position vs. time curve at a specific point.
Zero Velocity: Occurs where the graph is flat (horizontal tangent), meaning the position is not changing at that instant.
Step-by-Step Guidance
Look for points on the graph where the curve is flat (horizontal).
At these points, the slope (and thus the velocity) is zero.
Identify the labeled point(s) where this occurs, but do not state the answer yet.
Try solving on your own before revealing the answer!
Final Answer:
The professor's velocity is zero at point IV, where the position vs. time graph is flat (horizontal tangent).
Q3. What was the soccer player's average speed for the entire exercise?
Background
Topic: Average Speed Calculation
This question tests your ability to calculate average speed using total distance and total time for a multi-part journey.
Key Terms and Formulas:
Average Speed:
Total Distance: Add up all segments of the journey, regardless of direction.
Total Time: Add up the time for all segments.
Step-by-Step Guidance
Sum the distances for all sprints (out and back for 10 m, 20 m, and 30 m).
Add the times for all segments to get the total time.
Set up the formula for average speed using the total distance and total time.
Do not compute the final value yet; leave the calculation for the next step.
Try solving on your own before revealing the answer!
Final Answer:
The soccer player's average speed is .
This is found by dividing the total distance (120 m) by the total time (41.7 s).
Q4. What was the soccer player's average velocity for the entire exercise?
Background
Topic: Average Velocity Calculation
This question tests your understanding of displacement and how it differs from total distance when calculating average velocity.
Key Terms and Formulas:
Average Velocity:
Displacement: The straight-line distance from the starting point to the ending point (can be zero if you return to the start).
Step-by-Step Guidance
Determine the player's starting and ending positions.
Calculate the total displacement (difference between final and initial positions).
Set up the formula for average velocity using the displacement and total time.
Do not compute the final value yet; leave the calculation for the next step.
Try solving on your own before revealing the answer!
Final Answer:
The soccer player's average velocity is .
This is because the total displacement is zero (the player returns to the starting point), so average velocity is zero regardless of the total time.
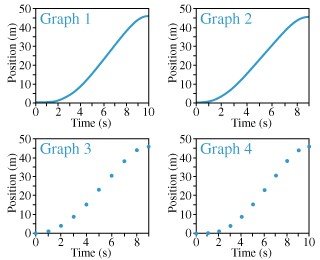
Q5. Which graph best represents the object's position vs. time?
Background
Topic: Graphical Representation of Motion
This question asks you to match a table of position values to the correct position vs. time graph, focusing on the shape and curvature of the graph.
Key Terms and Formulas:
Position vs. Time Graph: Shows how an object's position changes over time.
Curvature: A curved graph indicates changing velocity (acceleration).
Step-by-Step Guidance
Examine the table of position values and note how the position changes with each second.
Look for patterns: Is the position increasing by larger amounts each second (indicating acceleration)?
Compare the table to the provided graphs and identify which one matches the pattern of increasing increments.
Do not state the final answer yet; just set up your reasoning.
Try solving on your own before revealing the answer!
Final Answer:
The correct graph is Graph 1, which shows a parabolic curve opening upward, matching the increasing increments in the position table (indicating positive acceleration).
