 Indietro
Chapter 1: Graphs – Introduction to Graphing Equations and Graphing Utilities
Guida di studio - Note intelligenti
 Appunti personalizzati basati sui tuoi materiali, ampliati con definizioni chiave, esempi e contesto.
Chapter 1: Graphs
Section 1.1: Graphing Utilities; Introduction to Graphing Equations
This section introduces the foundational concepts of graphing equations in two variables, the use of graphing utilities, and the interpretation of intercepts. Mastery of these skills is essential for understanding more advanced topics in Precalculus.
Equations in Two Variables and Their Graphs
Equation in Two Variables: A statement where two expressions involving variables x and y are set equal.
Solution: Any pair (x, y) that makes the equation true is a solution.
Graph of an Equation: The set of all points (x, y) in the xy-plane that satisfy the equation.
Graphing Equations by Plotting Points
To graph an equation, select values for x, compute the corresponding y values, plot the points, and connect them smoothly.
Step 1: Choose several values for x and solve for y.
Step 2: Plot the resulting points (x, y) on the coordinate plane.
Step 3: Connect the points to reveal the graph's shape.
Example 1: Determining Whether a Point Is on the Graph of an Equation
Given the equation , check if (2, 3) is on the graph:
Substitute: (not on the graph).
Check (2, -2): (on the graph).
Example 2: Graphing a Linear Equation by Plotting Points
Graph the equation by creating a table of values and plotting the points.
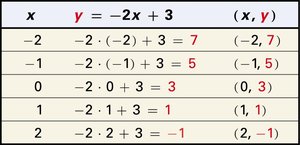
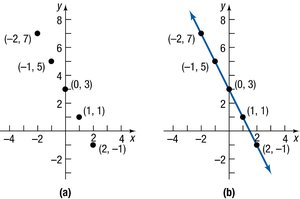
Example 3: Graphing a Quadratic Equation by Plotting Points
Graph the equation by creating a table of values and plotting the points.
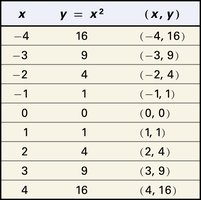
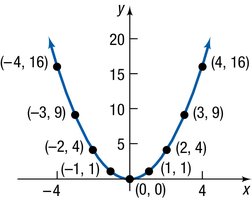
Graphing Equations Using a Graphing Utility
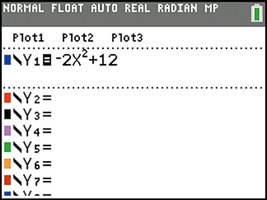
Graphing utilities (such as graphing calculators or software) can be used to graph equations efficiently. Most require the equation to be solved for y in terms of x (i.e., ).
Step 1: Solve the equation for y if necessary.
Step 2: Enter the equation into the graphing utility.
Step 3: Choose an appropriate viewing window (often the standard window: , ).
Step 4: Graph the equation and adjust the window as needed to see the complete graph.
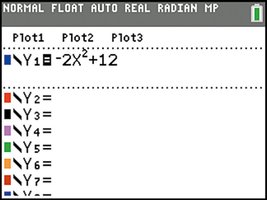
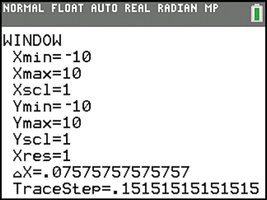
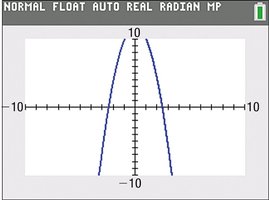
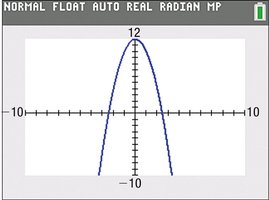
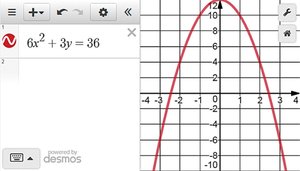
Some utilities (like Desmos) allow equations to be entered in forms other than .
Using a Graphing Utility to Create Tables
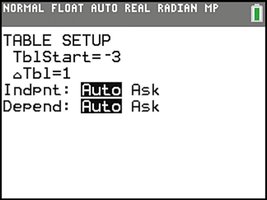
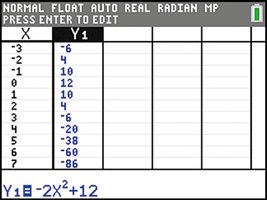
Graphing utilities can generate tables of values for an equation, which helps in plotting graphs and understanding function behavior.
Table Modes: AUTO (automatic increments) and ASK (user-specified values).
TblStart: Starting value for x.
ΔTbl: Increment for x values.
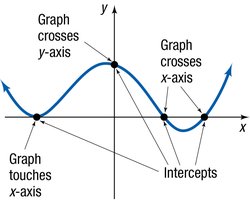
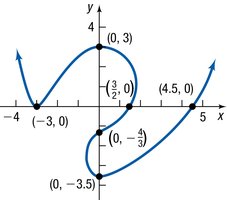
Finding Intercepts from a Graph
Intercepts are points where the graph crosses or touches the axes:
x-intercept: Where the graph crosses the x-axis ().
y-intercept: Where the graph crosses the y-axis ().
Using a Graphing Utility to Approximate Intercepts
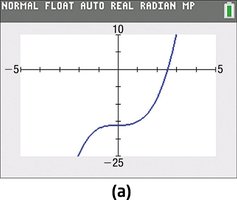
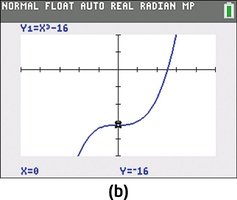
Graphing utilities can be used to estimate intercepts numerically:
eVALUEate feature: Input a value for x to find y (for y-intercept).
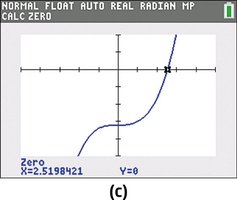
ZERO feature: Find where the graph crosses the x-axis (for x-intercept).
Example: For , the y-intercept is (when ), and the x-intercept is approximately (when ).
Summary Table: Key Features of Graphing Utilities
Feature | Description | Example Utility |
|---|---|---|
Graphing | Plots equations in two variables | TI-84, Desmos |
Table Generation | Creates tables of (x, y) values | TI-84, GeoGebra |
Intercept Approximation | Numerically estimates x- and y-intercepts | TI-84 (ZERO, eVALUEate) |
Window Adjustment | Changes viewing area for complete graph | All major utilities |
Additional info: Understanding how to use graphing utilities is foundational for success in Precalculus, as it allows for visualization and analysis of a wide variety of functions and equations.
