 Indietro
Chapter 1: Linear Functions, Equations, and Inequalities – Study Notes
Guida di studio - Note intelligenti
 Appunti personalizzati basati sui tuoi materiali, ampliati con definizioni chiave, esempi e contesto.
Linear Functions, Equations, and Inequalities
Linear Functions
A linear function is a function of the form , where a and b are real numbers. The graph of a linear function is a straight line. The solution to a linear equation is an ordered pair that satisfies the equation.
Standard form:
Graph: A straight line in the Cartesian plane
Intercepts: Points where the graph crosses the axes
Locating x- and y-Intercepts
To find the intercepts of the graph of (assuming ):
x-intercept: Set and solve for .
y-intercept: Set and solve for .
Zero of a Function and x-Intercepts
A zero of a function is any number in the domain of for which . The point is an x-intercept of the graph of .
Graphing a Linear Function
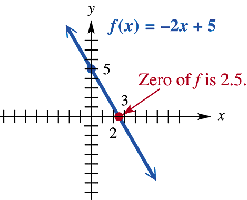
To graph :
Find the y-intercept:
Find the x-intercept (zero): Set
Plot both intercepts and draw the line through them.
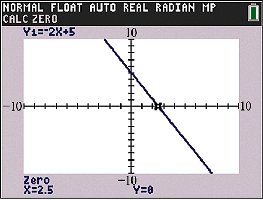
A graphing calculator can also be used to verify the intercepts and the zero of the function.
Modeling with Linear Functions
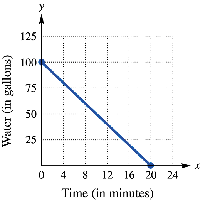
Example: A 100-gallon tank is drained at 5 gallons per minute.
Function: models the gallons left after minutes.
y-intercept: (initial amount)
x-intercept: (time to empty the tank)
Constant Functions
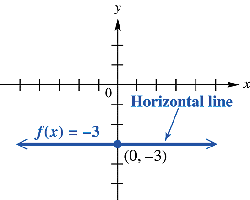
A constant function is defined by , where is a real number. Its graph is a horizontal line at . For , it has no x-intercept.
Example: is a horizontal line through .
Comprehensive Graphs of Lines
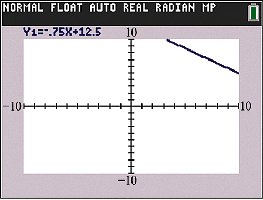
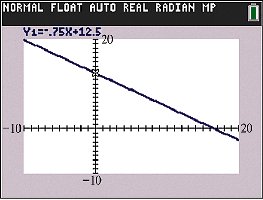
To obtain a comprehensive graph of a line, adjust the viewing window so that both intercepts are visible. For :
A window of by may not show both intercepts.
Expanding to by reveals both intercepts.
Slope of a Line
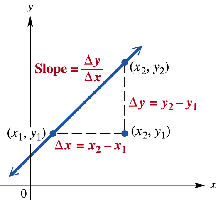
The slope of a line passing through points and is given by:
Using the Slope Formula
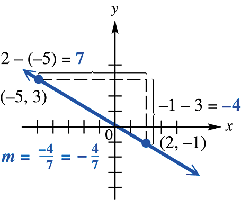
Example: Find the slope of the line through and .
Using Slope and a Point to Graph a Line
Given a point and a slope, plot the point and use the slope (rise over run) to find another point. Draw the line through both points.
Geometric Orientation Based on Slope
If , the line rises from left to right.
If , the line falls from left to right.
If , the line is horizontal.
A vertical line has an undefined slope and equation .
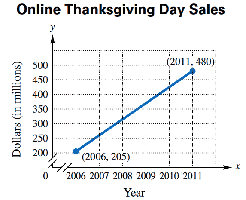
Interpreting Slope as Average Rate of Change
The slope of a line segment connecting two points and represents the average rate of change of with respect to .
Example: Online sales increased from $205 million in 2011.
Average rate of change: million per year.
Slope-Intercept Form
The slope-intercept form of a line is , where is the slope and is the y-intercept.
Matching Graphs with Equations
Given several lines, match each to its equation by analyzing the sign of the slope and the y-intercept:
If , the line rises; if , it falls.
If , the y-intercept is above the x-axis; if , below.
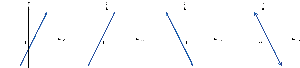
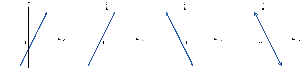
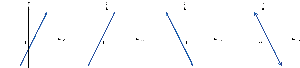
: B (rises, y-intercept positive)
: D (falls, y-intercept positive)
: A (rises, y-intercept negative)
: C (falls, y-intercept negative)
Interpreting Slope–Intercept Form in Applications
Example: In 2006, 60 billion text messages were sent in the U.S. The number increased by 407 billion per year for the next 6 years.
Let correspond to 2006, so
Rate of change
Model:
For 2012 (): billion messages
Finding an Equation from a Graph
Given a graph, determine:
Slope: Calculate rise over run between two points.
y-intercept: Where the line crosses the y-axis.
x-intercept: Where the line crosses the x-axis.
Equation: Use the slope and y-intercept in .
Zero: The x-coordinate of the x-intercept.
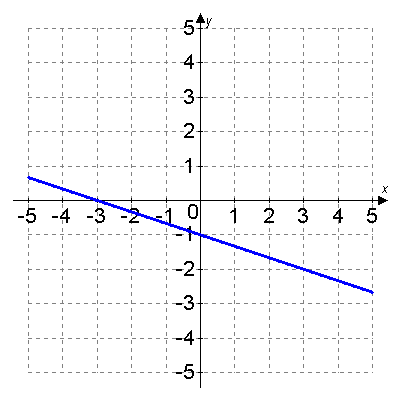
Example: Slope is , y-intercept is , x-intercept is . Equation: .
