 Indietro
Graphing Equations and Using Graphing Utilities in Precalculus
Guida di studio - Note intelligenti
 Appunti personalizzati basati sui tuoi materiali, ampliati con definizioni chiave, esempi e contesto.
Graphs
Introduction to Graphing Equations
Graphing equations is a foundational skill in precalculus, allowing us to visualize relationships between variables. An equation in two variables, such as x and y, is a statement where two expressions involving these variables are set equal. The graph of such an equation is the set of all points (x, y) in the coordinate plane that satisfy the equation.
Graphing Equations by Plotting Points
Determining Whether a Point Is on the Graph
To check if a point lies on the graph of an equation, substitute the coordinates into the equation and verify if the statement is true.
Example: For the equation :
Point (2, 3): (not on the graph)
Point (2, -2): (on the graph)
How to Graph an Equation by Plotting Points
To graph an equation, select values for x, compute the corresponding y values, plot the resulting points, and connect them smoothly.
Step 1: Create a table of values for the equation .
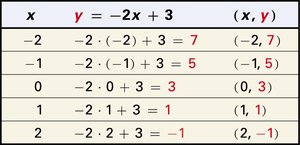
Step 2: Plot the points and connect them to form the graph (a straight line).
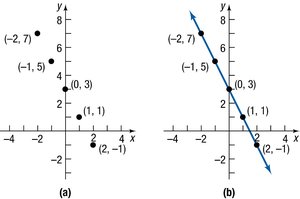
Example: For , the table and graph are as follows:
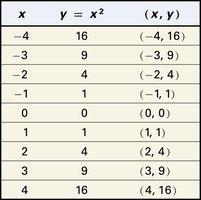
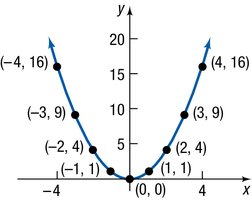
Graphing Equations Using a Graphing Utility
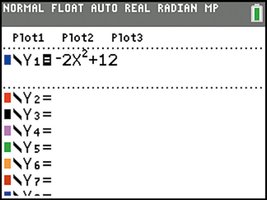
Preparing the Equation for Graphing
Most graphing utilities require equations to be in the form . If not, rearrange the equation algebraically.
Example: To graph , enter it as shown below:
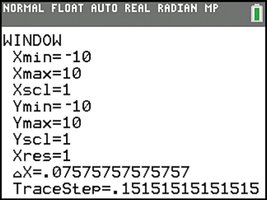
Choosing a Viewing Window
The viewing window determines which portion of the graph is displayed. The standard window is typically and .
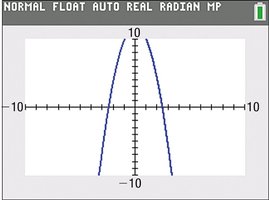
Graphing and Adjusting the Window
After entering the equation, graph it. If the graph is incomplete, adjust the window settings (e.g., increase Ymax).
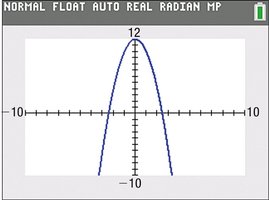
Graphing with Online Utilities
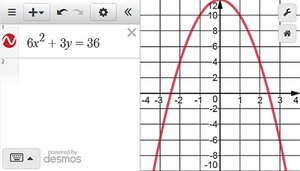
Some utilities, like Desmos, allow direct entry of equations without rearranging to form.
Using a Graphing Utility to Create Tables
Creating Tables of Values
Graphing calculators can generate tables of values for a given equation, which helps in plotting graphs and understanding function behavior.
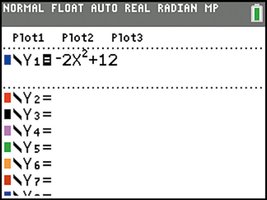
Step 1: Enter the equation in the calculator.
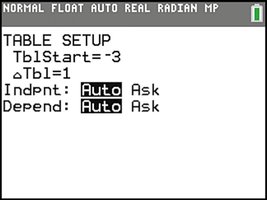
Step 2: Set up the table (choose starting value and increment).
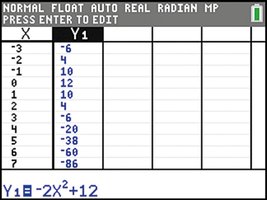
Step 3: View the generated table of values.
Finding Intercepts from a Graph
Definition of Intercepts
Intercepts are points where the graph crosses or touches the axes:
x-intercept: Where the graph crosses the x-axis ()
y-intercept: Where the graph crosses the y-axis ()
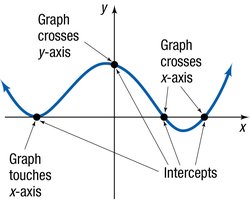
Example: Finding Intercepts from a Graph
Identify the intercepts by observing where the graph crosses the axes.
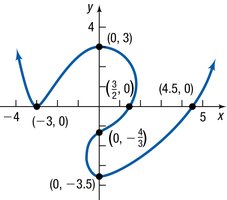
Using a Graphing Utility to Approximate Intercepts
Approximating Intercepts
Graphing calculators have features to approximate intercepts:
eVALUEate: Input a value for x to find y (for y-intercept, set ).
ZERO: Finds the value of x where (x-intercept).
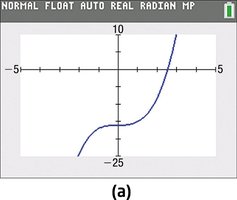
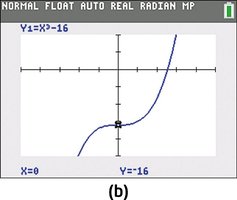
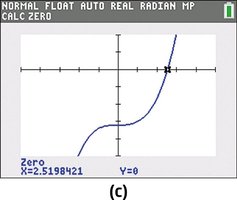
Example: For a given equation, the y-intercept is found to be -16, and the x-intercept is approximately 2.52.
Summary Table: Key Graphing Utility Features
Feature | Purpose | Example Use |
|---|---|---|
Graph | Visualize equation | Plot |
Table | Generate (x, y) pairs | Find values for |
Window | Adjust viewing area | Set |
eVALUEate | Find y for given x | Find y-intercept () |
ZERO | Find x for | Find x-intercept |
