 Indietro
Graphs and Transformations of Sine and Cosine Functions
Guida di studio - Note intelligenti
 Appunti personalizzati basati sui tuoi materiali, ampliati con definizioni chiave, esempi e contesto.
Graphs of the Sine and Cosine Functions
Objectives
This section covers the fundamental properties and transformations of the sine and cosine functions. Students will learn to:
Recall the basic shapes and key features of y = sin x and y = cos x.
Graph transformations of sinusoids: y = A \sin(Bx - C) + D and y = A \cos(Bx - C) + D.
Read amplitude, period, phase shift, and midline from an equation (and vice versa).
Period and Zeros/Extrema
Both sin x and cos x are periodic functions with period (or 360°). Their zeros and extrema are as follows:
sin x: Zeros at ; maximum $1x = \frac{\pi}{2} + 2n\pi-1$ at $x = \frac{3\pi}{2} + 2n\pi$.
cos x: Zeros at ; maximum $1x = 2n\pi-1$ at $x = \pi + 2n\pi$.
Key Values of Sine and Cosine on [0, 2π]
The following tables summarize the values of sin x and cos x at key points in one period:
cos x on [0, 2\pi] | 0 | \frac{\pi}{2} | \pi | \frac{3\pi}{2} | 2\pi |
|---|---|---|---|---|---|
y | 1 | 0 | -1 | 0 | 1 |
sin x on [0, 2\pi] | 0 | \frac{\pi}{2} | \pi | \frac{3\pi}{2} | 2\pi |
|---|---|---|---|---|---|
y | 0 | 1 | 0 | -1 | 0 |
General Sinusoid and Transformations
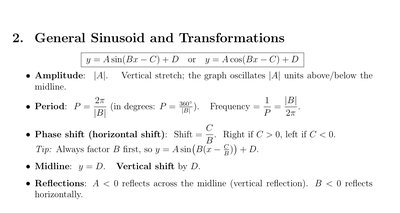
The general form for a sinusoidal function is y = A \sin(Bx - C) + D or y = A \cos(Bx - C) + D. Each parameter affects the graph in a specific way:
Amplitude: . This is the vertical stretch; the graph oscillates $|A|$ units above and below the midline.
Period: (in degrees: ). Frequency: .
Phase shift (horizontal shift): Shift . Right if , left if . Tip: Always factor first, so .
Midline: . This is a vertical shift by .
Reflections: reflects across the midline (vertical reflection). reflects horizontally.
Example: Constructing a Cosine Function from Parameters
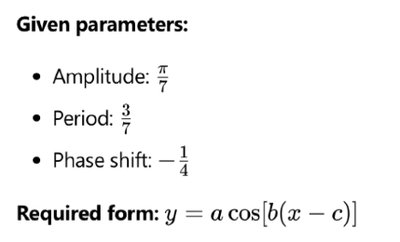
Given the following parameters:
Amplitude:
Period:
Phase shift:
The required form is:
Graphing Sinusoidal Functions
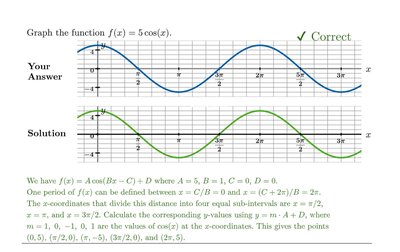
To graph a function such as f(x) = 5 \cos(x):
Identify , , , .
One period of can be defined between and .
The -coordinates that divide this distance into four equal sub-intervals are , , and .
Calculate the corresponding -values using , where (the values of at the -coordinates).
Example: Graph of a Sinusoidal Function
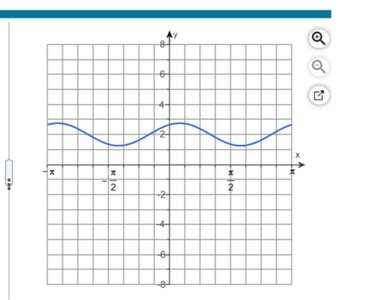
The graph below shows a sinusoidal function with amplitude, period, and midline clearly visible. The function oscillates between its maximum and minimum values, demonstrating the effect of amplitude and period.
Summary Table: Sinusoidal Function Parameters
Parameter | Effect on Graph |
|---|---|
Amplitude () | Vertical stretch; distance from midline to peak |
Period () | Length of one cycle; |
Phase Shift () | Horizontal shift; right if , left if |
Midline () | Vertical shift; midline at |
Reflection | reflects vertically; reflects horizontally |
Practice and Applications
Given a sinusoidal equation, identify amplitude, period, phase shift, and midline.
Graph sinusoidal functions using these parameters.
Apply transformations to model real-world periodic phenomena, such as sound waves or seasonal temperature changes.
