 Indietro
Graphs of Equations in Two Variables: Intercepts and Symmetry
Guida di studio - Note intelligenti
 Appunti personalizzati basati sui tuoi materiali, ampliati con definizioni chiave, esempi e contesto.
Graphs of Equations in Two Variables
Plotting Points to Graph Equations
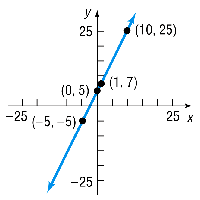
Graphing equations in two variables is a fundamental skill in precalculus. The graph of an equation consists of all points (x, y) that satisfy the equation. To graph an equation, assign values to one variable and solve for the other, then plot the resulting points.
Key Point: The graph of y = 2x + 5 is a straight line. By choosing values for x and calculating corresponding y values, you can plot several points and connect them to form the graph.
Example: For x = 0, y = 5; for x = 1, y = 7; for x = 10, y = 25.
Finding Intercepts from a Graph
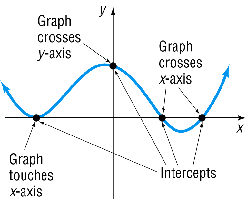
Intercepts are points where the graph crosses the axes. The x-intercept is where the graph crosses the x-axis (y = 0), and the y-intercept is where it crosses the y-axis (x = 0).
Key Point: Intercepts are useful for sketching and analyzing graphs.
Example: A graph may have multiple x-intercepts and y-intercepts.
Finding Intercepts from an Equation
To find intercepts algebraically:
x-intercept: Set y = 0 in the equation and solve for x.
y-intercept: Set x = 0 in the equation and solve for y.
Example: For the equation y = 2x + 5:
x-intercept: Set y = 0, so 0 = 2x + 5 ⇒ x = -2.5
y-intercept: Set x = 0, so y = 5
Graphical Representation of Intercepts
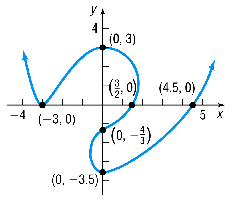
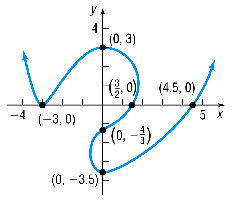
Graphs often display intercepts as labeled points where the curve crosses the axes.
Symmetry in Graphs
Types of Symmetry
Symmetry is a property that helps classify graphs and equations. There are three main types:
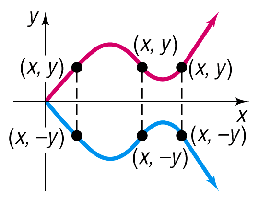
Symmetry with respect to the x-axis: If (x, y) is on the graph, so is (x, -y).
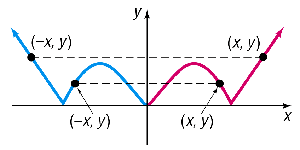
Symmetry with respect to the y-axis: If (x, y) is on the graph, so is (-x, y).
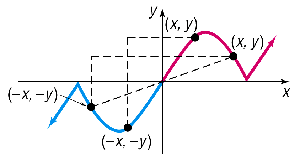
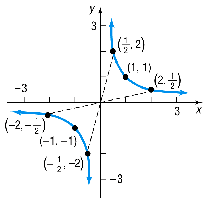
Symmetry with respect to the origin: If (x, y) is on the graph, so is (-x, -y).
Testing for Symmetry Algebraically
To test an equation for symmetry:
x-axis: Replace y with -y. If the equation is unchanged, it is symmetric about the x-axis.
y-axis: Replace x with -x. If the equation is unchanged, it is symmetric about the y-axis.
Origin: Replace x with -x and y with -y. If the equation is unchanged, it is symmetric about the origin.
Graphical Representation of Symmetry
Symmetry can be visualized by reflecting points across axes or the origin.
x-axis symmetry: Reflect points across the x-axis.
y-axis symmetry: Reflect points across the y-axis.
Origin symmetry: Reflect points across both axes.
Graphing Key Equations
Examples of Key Graphs
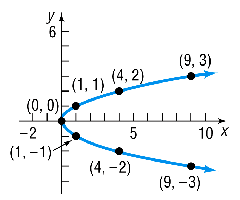
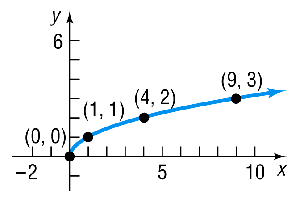
Understanding the shapes of key equations is essential for precalculus. Common graphs include lines, parabolas, and other polynomial curves.
Linear Equations: Graphs are straight lines.
Quadratic Equations: Graphs are parabolas.
Other Equations: May produce curves with multiple intercepts or symmetry.
Summary Table: Symmetry Tests
Type of Symmetry | Algebraic Test | Graphical Effect |
|---|---|---|
x-axis | Replace y with -y | Reflect across x-axis |
y-axis | Replace x with -x | Reflect across y-axis |
Origin | Replace x with -x and y with -y | Reflect across both axes |
Key Formulas
Distance Formula:
Midpoint Formula:
Additional info: The notes above expand on the brief points in the original material, providing definitions, examples, and academic context for each topic. All images included are directly relevant to the explanation of the adjacent paragraph, visually reinforcing the mathematical concepts discussed.
