 Indietro
Linear Correlation and Modeling: Study Notes for Precalculus
Guida di studio - Note intelligenti
 Appunti personalizzati basati sui tuoi materiali, ampliati con definizioni chiave, esempi e contesto.
Linear Correlation and Modeling
Linear Correlation, Scatterplots, and Modeling
Linear correlation is a statistical method used to measure the strength and direction of the relationship between two quantitative variables. In Precalculus, linear correlation is often applied to real-world data to determine how closely two variables are related and to create predictive models.
Scatterplots: Visual representations of data points for two variables. Patterns in scatterplots indicate the type and strength of correlation.
Linear Model: An equation of the form used to describe the relationship between two variables.
Correlation Coefficient (r)
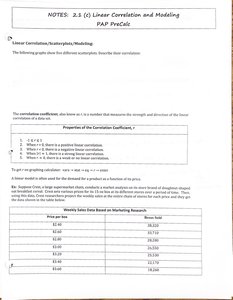
The correlation coefficient, denoted as r, is a numerical value that quantifies the strength and direction of a linear relationship between two variables.
Range:
Interpretation:
: Positive linear correlation
: Negative linear correlation
: Strong linear correlation
: Weak or no linear correlation
Property | Description |
|---|---|
Range | -1 ≤ r ≤ 1 |
Positive Correlation | r > 0 |
Negative Correlation | r < 0 |
Strong Correlation | |r| ≈ 1 |
Weak/No Correlation | r ≈ 0 |
Modeling with Linear Functions
Linear models are commonly used to predict outcomes based on observed data. For example, the demand for a product can be modeled as a function of its price.
Example: Weekly sales data for a product at various prices can be used to create a linear model for demand.
Equation: , where is the dependent variable (e.g., boxes sold), is the independent variable (e.g., price), is the slope (rate of change), and is the y-intercept.
Application Example: Weekly Sales Data
The table below shows weekly sales data for a product at different prices. This data can be used to create a linear model for demand.
Price per box ($) | Boxes Sold |
|---|---|
2.40 | 38,320 |
2.60 | 33,710 |
2.80 | 28,280 |
3.00 | 26,550 |
3.20 | 25,530 |
3.40 | 22,170 |
3.60 | 18,260 |
Example Linear Model: Using regression techniques, a linear model can be found:
Interpretation: The slope () indicates that for each $1 increase in price, weekly sales decrease by about 15,359 boxes.
Prediction: The model can be used to estimate sales at other prices.
Properties and Uses of Linear Models
Strength and Direction: The correlation coefficient helps determine if the linear model is appropriate and how well it fits the data.
Revenue Modeling: Revenue can be modeled as , where is price and is the number of units sold.
Rate of Change: The slope of the linear model represents the average rate of change.
Additional info: Linear correlation and modeling are foundational concepts in Precalculus, providing tools for analyzing and predicting relationships between variables in real-world contexts.
