Indietro
Precalculus Review Worksheet: Functions, Transformations, Domain & Range, and Data Analysis
Guida di studio - Note intelligenti
 Appunti personalizzati basati sui tuoi materiali, ampliati con definizioni chiave, esempi e contesto.
Q1. Determine whether the relation is a function. For those that are functions, find the domain and range.
Background
Topic: Functions and Relations
This question tests your understanding of what makes a relation a function, and how to identify the domain and range from a graph or set of points.
Key Terms:
Function: A relation in which each input (x-value) has exactly one output (y-value).
Domain: The set of all possible input values (x-values).
Range: The set of all possible output values (y-values).
Step-by-Step Guidance
Examine the graph or set of points to see if any x-value is paired with more than one y-value. If so, it is not a function.
If it is a function, list all the x-values to determine the domain.
List all the y-values to determine the range.
Check if the domain and range should be written in interval notation or as a set of values.
Try solving on your own before revealing the answer!
Final Answer:
For the first graph, it is not a function because some x-values have multiple y-values. For the second set of points, it is a function. Domain: {-1, 0, 1, 2, 3}, Range: {4, 1, 0, 5, 2}.
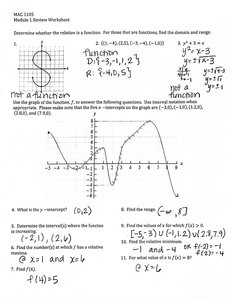
Q2. Use the graph of the function f to answer the following questions. Use interval notation where appropriate. Find the x-intercepts, y-intercept, domain, and range.
Background
Topic: Graph Analysis
This question tests your ability to read a graph and identify intercepts, domain, and range.
Key Terms:
x-intercept: Where the graph crosses the x-axis (y = 0).
y-intercept: Where the graph crosses the y-axis (x = 0).
Domain: All possible x-values for the graph.
Range: All possible y-values for the graph.
Step-by-Step Guidance
Look for points where the graph crosses the axes to find intercepts.
Identify the leftmost and rightmost x-values for the domain.
Identify the lowest and highest y-values for the range.
Write the domain and range in interval notation.
Try solving on your own before revealing the answer!
Final Answer:
x-intercepts: (-2,0), (1,0), (4,0). y-intercept: (0,2). Domain: [-5,7]. Range: [-3,8].
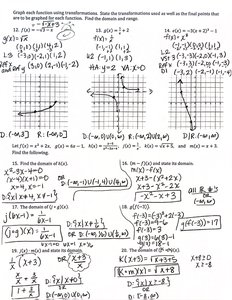
Q3. Graph each function using transformations. State the transformations used as well as the final points that are to be graphed for each function. Find the domain and range.
Background
Topic: Function Transformations
This question tests your understanding of how to apply transformations (shifts, stretches, reflections) to parent functions and how to determine domain and range after transformation.
Key Terms and Formulas:
Transformation: Changes to a function's graph, such as shifting, stretching, or reflecting.
Parent function: The basic form of a function (e.g., , ).
Domain and Range: Adjusted based on the transformation applied.
Step-by-Step Guidance
Identify the parent function and the type of transformation (vertical/horizontal shift, stretch, reflection).
Apply the transformation to the parent function's key points.
Plot the transformed points on the graph.
Determine the new domain and range based on the transformation.
Try solving on your own before revealing the answer!
Final Answer:
For : Shift left by 2 units. Domain: , Range: . For : Shift right by 1 unit. Domain: , Range: $[0, \infty)$. For : Reflect over x-axis. Domain: $[0, \infty)$, Range: .
Q4. Express h(x) as a composition of two functions f and g so that h(x) = f(g(x)).
Background
Topic: Function Composition
This question tests your ability to break down a function into a composition of two simpler functions.
Key Terms and Formulas:
Composition: means applying first, then .
Function: and are chosen so their composition gives .
Step-by-Step Guidance
Identify the inner function and the outer function such that .
Write as the part inside the main operation of .
Write as the operation applied to .
Check your composition by substituting into to see if you get .
Try solving on your own before revealing the answer!
Final Answer:
For , and . So .
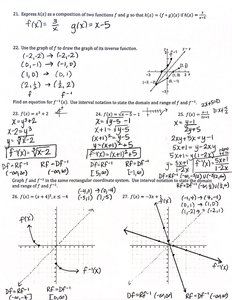
Q5. Use the graph of f to draw the graph of its inverse function. Find an equation for and state the domain and range.
Background
Topic: Inverse Functions
This question tests your ability to find and graph the inverse of a function, and to determine its domain and range.
Key Terms and Formulas:
Inverse function: reverses the effect of .
Domain and Range: The domain of becomes the range of and vice versa.
Equation: To find , solve for in terms of .
Step-by-Step Guidance
List the points on the graph of and swap the x and y values to get points for .
Plot these new points to sketch the inverse graph.
Write the equation for by solving for .
State the domain and range for using interval notation.
Try solving on your own before revealing the answer!
Final Answer:
If , then . Domain and range are swapped from .
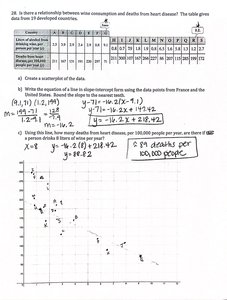
Q6. Is there a relationship between wine consumption and deaths from heart disease? The table gives data from 19 developed countries. Create a scatterplot and write the equation of a line in slope-intercept form using two data points.
Background
Topic: Data Analysis and Linear Regression
This question tests your ability to interpret data, create a scatterplot, and find the equation of a line using two points.
Key Terms and Formulas:
Scatterplot: A graph of points showing the relationship between two variables.
Slope-intercept form:
Slope:
Step-by-Step Guidance
Plot the data points from the table on a scatterplot.
Choose two points and use them to calculate the slope .
Use the slope and one point to solve for the y-intercept .
Write the equation in the form .
Try solving on your own before revealing the answer!
Final Answer:
Using points (9,171) and (1,212): Slope . Equation: .
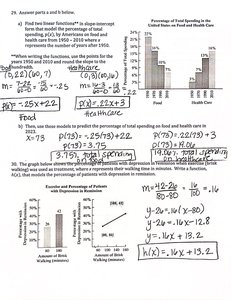
Q7. Find linear functions in slope-intercept form that model the percentage of total spending on food and health care in the United States from 1950–2010.
Background
Topic: Linear Modeling
This question tests your ability to use data to create linear models for real-world situations.
Key Terms and Formulas:
Slope-intercept form:
Linear model: An equation that describes a linear relationship between two variables.
Step-by-Step Guidance
Identify two data points for each category (food and health care).
Calculate the slope for each set of points.
Use the slope and one point to solve for the y-intercept .
Write the linear equation for each category.
Try solving on your own before revealing the answer!
Final Answer:
Food: . Health care: .