Indietro
Properties of Functions: Even/Odd, Increasing/Decreasing, Extrema, and Average Rate of Change
Guida di studio - Note intelligenti
 Appunti personalizzati basati sui tuoi materiali, ampliati con definizioni chiave, esempi e contesto.
Functions and Their Graphs
Even and Odd Functions
Understanding whether a function is even, odd, or neither is fundamental in precalculus. These properties are determined both algebraically and graphically, and they reveal important symmetries in the function's graph.
Even Function: A function f is even if, for every number x in its domain, –x is also in the domain and . The graph of an even function is symmetric with respect to the y-axis.
Odd Function: A function f is odd if, for every number x in its domain, –x is also in the domain and . The graph of an odd function is symmetric with respect to the origin.
Neither: If a function does not satisfy either condition, it is neither even nor odd.
Example: is even, is neither, is odd, is even.
Increasing, Decreasing, and Constant Functions
Functions can exhibit different behaviors over intervals: they may increase, decrease, or remain constant. These properties are essential for analyzing the shape and trends of graphs.
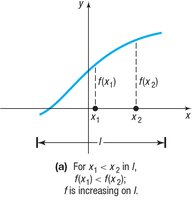
Increasing Function: f is increasing on interval I if, for any x_1 < x_2 in I, .
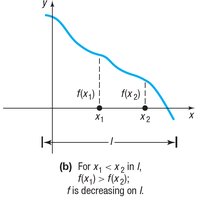
Decreasing Function: f is decreasing on interval I if, for any x_1 < x_2 in I, .
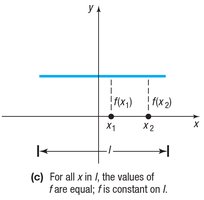
Constant Function: f is constant on interval I if, for all x in I, is equal.
Local Maxima and Minima
Local maxima and minima are points where a function reaches a highest or lowest value within a neighborhood. These are important for understanding the peaks and valleys of a function's graph.
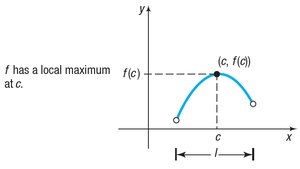
Local Maximum: f has a local maximum at c if there is an open interval containing c such that for all x in that interval.
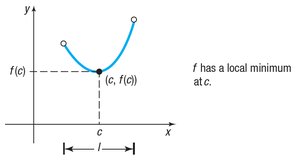
Local Minimum: f has a local minimum at c if there is an open interval containing c such that for all x in that interval.
Absolute Maximum and Minimum
The absolute maximum and minimum are the highest and lowest values a function attains on a given interval. These are critical for optimization and analysis.
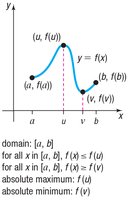
Absolute Maximum: f has an absolute maximum at u if for all x in the interval.
Absolute Minimum: f has an absolute minimum at v if for all x in the interval.
Extreme Value Theorem
The Extreme Value Theorem states that if a function is continuous on a closed interval [a, b], then it must attain both an absolute maximum and an absolute minimum on that interval.
Continuity: For precalculus, a function is considered continuous if its graph has no gaps or holes and can be drawn without lifting the pencil.
Using Graphing Utilities to Approximate Extrema and Intervals of Increase/Decrease
Graphing calculators and software can be used to find approximate values for local maxima and minima, and to determine where a function is increasing or decreasing.
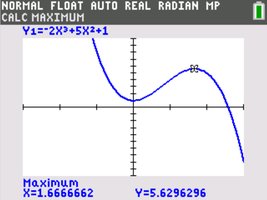
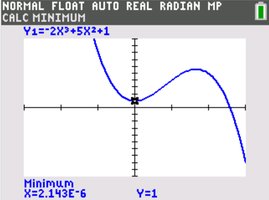
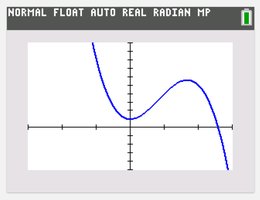
Example: For on , the graphing utility finds a local maximum at with , and a local minimum at with .
Intervals: The function is increasing on and decreasing on and .
Average Rate of Change
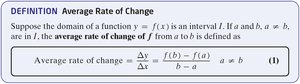
The average rate of change of a function over an interval measures how much the function's output changes per unit change in input. It is analogous to the slope of a secant line between two points on the graph.
Definition: For a function and interval , the average rate of change is .
Example: For :
From 0 to 1:
From 1 to 2:
From 0 to 2:
Slope of a Secant Line
The slope of the secant line between two points on a function's graph is equal to the average rate of change over that interval. This concept is foundational for calculus and helps visualize how a function changes.
Formula: The slope of the secant line through and is .
Example: For , between and , . The equation of the secant line is .