 Indietro
Study Guide: Functions and Their Properties in Precalculus
Guida di studio - Note intelligenti
 Appunti personalizzati basati sui tuoi materiali, ampliati con definizioni chiave, esempi e contesto.
Functions and Their Properties
Function Definition and Notation
A function is a rule that assigns each element in a set called the domain to exactly one element in a set called the range. The notation f(x) is used to denote the value of the function at x, where x is the independent variable and y = f(x) is the dependent variable.
Domain: The set of all possible input values (x).
Range: The set of all possible output values (y).
Function Notation:
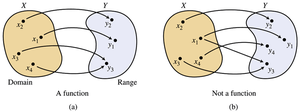
Example: In the mapping diagram, (a) shows a function because each input is paired with only one output, while (b) is not a function because some inputs are paired with multiple outputs.
Graphical Representation and the Vertical Line Test
To determine if a graph represents a function, use the vertical line test: a graph is a function if no vertical line intersects it at more than one point.
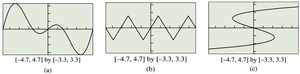
Key Point: The graph in (c) fails the vertical line test, so it is not a function.
Domain and Range: Agreement and Examples
The domain of a function defined by an algebraic expression is typically the set of all real numbers for which the expression is defined, unless context restricts it. The range is the set of all possible output values.
Finding Domain: For , the domain is .
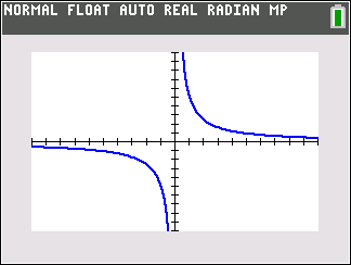
Finding Range: For , the range is all real numbers except zero.
Increasing, Decreasing, and Constant Functions
A function can be classified as increasing, decreasing, or constant on intervals based on how its output changes as the input increases.
Increasing: for
Decreasing: for
Constant: for
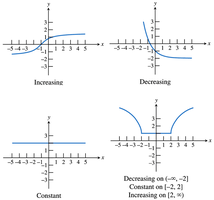
Example: The bottom right graph shows a function that is decreasing on , constant on , and increasing on .
Analyzing Increasing-Decreasing Behavior
To analyze a function for intervals of increase, decrease, or constancy, examine its graph or use calculus techniques (if available).
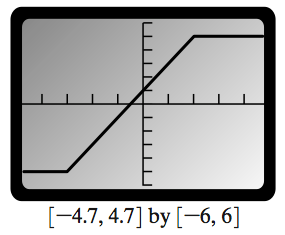
Example: The graph is constant on , increasing on , and decreasing on .
Boundedness
A function is bounded below if there is a number such that for all in the domain. It is bounded above if there is a number such that for all . If both conditions are met, the function is bounded.
Lower Bound: where
Upper Bound: where
Local and Absolute Extrema
Local extrema are the highest or lowest values of a function within a specific interval. Absolute extrema are the highest or lowest values over the entire domain.
Local Maximum: is greater than or equal to all nearby values.
Local Minimum: is less than or equal to all nearby values.
Absolute Maximum: is the greatest value over the domain.
Absolute Minimum: is the least value over the domain.
Symmetry of Functions
Functions may exhibit symmetry with respect to the y-axis, x-axis, or origin. These symmetries help classify functions as even, odd, or neither.
Even Function: for all in the domain.
Odd Function: for all in the domain.
Neither: If neither condition is satisfied.
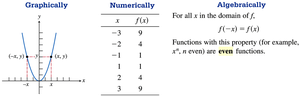
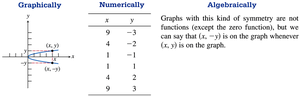
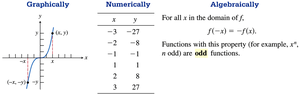
Example: The table and graph in image_7 show an even function, image_8 shows symmetry with respect to the x-axis, and image_9 shows an odd function.
Continuity and Discontinuity
A function is continuous at a point if its graph has no breaks, jumps, or holes at that point. Types of discontinuities include removable, jump, and infinite discontinuities.
Continuous: No breaks in the graph.
Removable Discontinuity: A hole in the graph at a single point.
Jump Discontinuity: The graph jumps from one value to another.
Infinite Discontinuity: The graph approaches infinity at a point.
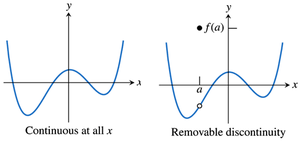
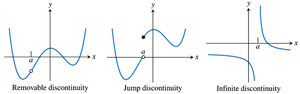
Example: The left graph in image_10 is continuous everywhere; the right graph has a removable discontinuity at . Image_11 shows all three types of discontinuities.
Asymptotes
Asymptotes are lines that a graph approaches but never touches. Horizontal asymptotes describe end behavior as , while vertical asymptotes occur where the function is undefined and the graph goes to infinity.
Horizontal Asymptote: if
Vertical Asymptote: if
Example: For , is a vertical asymptote and is a horizontal asymptote.
Summary Table: Types of Function Symmetry
Type | Algebraic Condition | Graphical Feature |
|---|---|---|
Even | Symmetric about y-axis | |
Odd | Symmetric about origin | |
Neither | Neither condition holds | No symmetry |
Summary Table: Types of Discontinuity
Type | Description |
|---|---|
Removable | Hole at a single point |
Jump | Graph jumps from one value to another |
Infinite | Graph approaches infinity at a point |
Additional info: Academic context was added to clarify definitions, examples, and the interpretation of images and tables. All equations are provided in LaTeX format as required.
