 Indietro
3-05: Study Notes: Rational Functions – Graphs, Asymptotes, and Applications
Guida di studio - Note intelligenti
 Appunti personalizzati basati sui tuoi materiali, ampliati con definizioni chiave, esempi e contesto.
Polynomial and Rational Functions
Introduction to Rational Functions
Rational functions are a central topic in precalculus, involving ratios of polynomials. Their graphs often display unique features such as asymptotes and discontinuities, which are essential for understanding their behavior and applications.
Definition: A rational function is any function of the form , where and are polynomials and .
Domain: All real numbers except those for which .
Discontinuity: Rational functions are often discontinuous at points where the denominator is zero.
The Reciprocal Function
Definition and Basic Properties
The reciprocal function is the simplest rational function with a variable denominator, given by .
Domain:
Range:
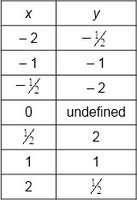
Discontinuity: The function is undefined at .
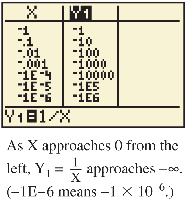
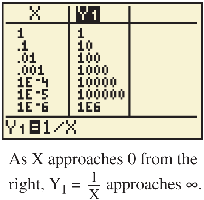
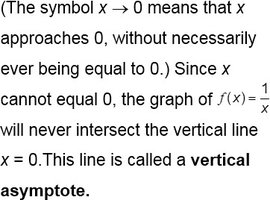
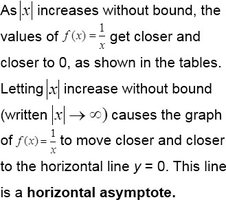
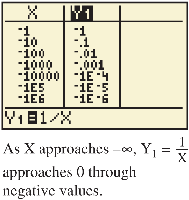
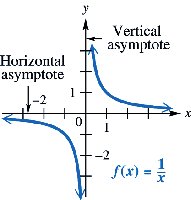
Asymptotes: The y-axis () is a vertical asymptote, and the x-axis () is a horizontal asymptote.
Graph and Symmetry
Odd Function: , so the graph is symmetric with respect to the origin.
Transformations of the Reciprocal Function
Vertical and Horizontal Shifts
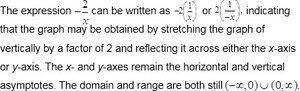
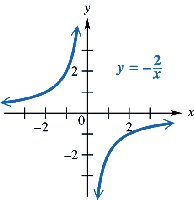
Multiplying by a constant stretches or compresses the graph.
Negative signs reflect the graph across the axes.
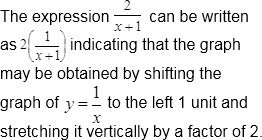
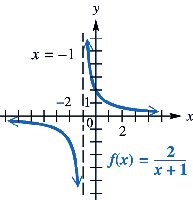
Shifting the input, as in , moves the graph horizontally.
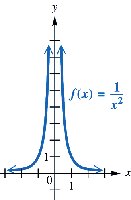
The Function
Definition and Properties
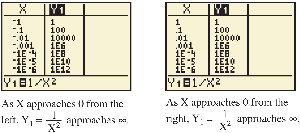
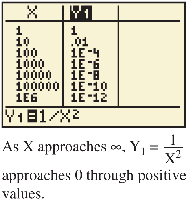
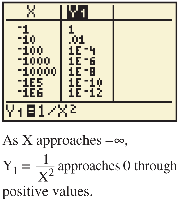
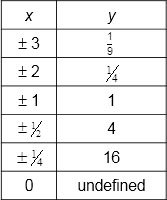
This rational function is defined for all real numbers except and is always positive.
Domain:
Range:
Even Function: , so the graph is symmetric with respect to the y-axis.
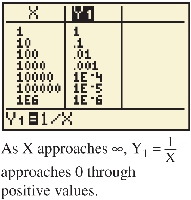
Asymptotes: The y-axis () is a vertical asymptote, and the x-axis () is a horizontal asymptote.
Graphing Rational Functions
General Steps for Graphing
To sketch the graph of a rational function , follow these steps:
Find any vertical asymptotes by setting and solving for .
Find any horizontal or oblique asymptotes by comparing the degrees of and .
Find the y-intercept by evaluating .
Find the x-intercepts by solving .
Determine if the graph intersects its nonvertical asymptote by solving or .
Plot additional points as needed to understand the graph's behavior in each interval.
Complete the sketch, noting intervals of increase and decrease.
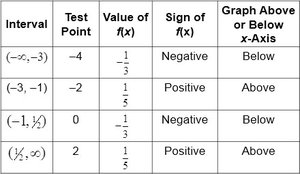
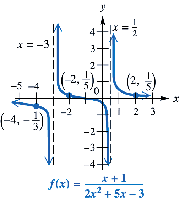
Example: Graphing
Vertical asymptotes at and .
Horizontal asymptote at (since degree of numerator < denominator).
Find intercepts and plot points in each interval.
Asymptotes of Rational Functions
Types of Asymptotes
Vertical Asymptotes: Occur at zeros of the denominator (after simplification).
Horizontal Asymptotes: Determined by the degrees of numerator and denominator:
If degree numerator < degree denominator:
If degrees are equal: , where and are leading coefficients
If degree numerator is one more than denominator: Oblique (slant) asymptote, found by polynomial division
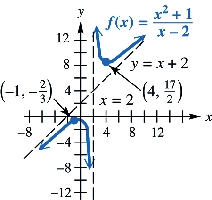
Example: Finding Asymptotes
For :
Vertical asymptote:
Oblique asymptote: (from division)
Points of Discontinuity (Holes)
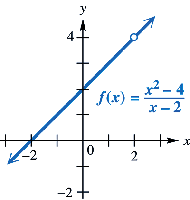
If a rational function is not in lowest terms, a factor that cancels in both numerator and denominator creates a hole in the graph at that x-value.
Example: has a hole at .
Applications: Rational Models
Example: Modeling Traffic Intensity
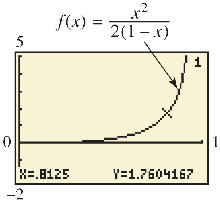
Rational functions can model real-world phenomena, such as traffic flow. For example, the average number of vehicles waiting in line at a parking ramp can be modeled by a rational function of the form , where is the traffic intensity (arrival rate/admittance rate).
As approaches 1, increases rapidly, indicating long wait times as the system nears capacity.
Summary Table: Types of Asymptotes
Case | Condition | Asymptote |
|---|---|---|
Vertical | Denominator zero (after simplification) | |
Horizontal | Degree numerator < denominator | |
Horizontal | Degrees equal | |
Oblique | Degree numerator one more than denominator | Line from division |
Key Takeaways
Rational functions are quotients of polynomials with important features such as asymptotes and discontinuities.
Graphing involves identifying asymptotes, intercepts, and behavior near undefined points.
Transformations and shifts affect the position and orientation of the graph.
Applications include modeling real-world systems with constraints and rates.
