Indietro
Twelve Basic Functions and Their Properties in Precalculus
Guida di studio - Note intelligenti
 Appunti personalizzati basati sui tuoi materiali, ampliati con definizioni chiave, esempi e contesto.
Functions and Their Properties
Introduction to Basic Functions
Understanding the fundamental functions and their graphical representations is essential in precalculus. These functions serve as building blocks for more complex mathematical concepts and appear frequently in various applications. Recognizing their properties and graphs allows students to analyze and interpret mathematical models efficiently.
Twelve Basic Functions
Overview
The twelve basic functions are foundational in mathematics. Each has unique properties, domains, and ranges, and their graphs exhibit distinct shapes and behaviors. Below is a summary of each function, including its definition, properties, and a relevant example.
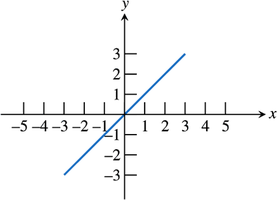
The Identity Function
The identity function is defined as . It maps every real number to itself and is linear.
Domain: All real numbers
Range: All real numbers
Graph: A straight line passing through the origin with slope 1
Example:
The Squaring Function
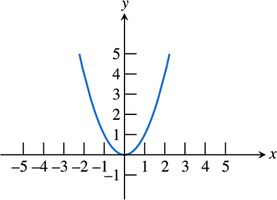
The squaring function is defined as . Its graph is a parabola opening upwards.
Domain: All real numbers
Range:
Graph: Parabola with vertex at the origin
Example:
The Cubing Function
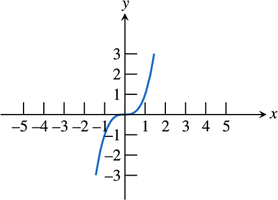
The cubing function is defined as . Its graph passes through the origin and has a point of inflection there.
Domain: All real numbers
Range: All real numbers
Graph: S-shaped curve
Example:
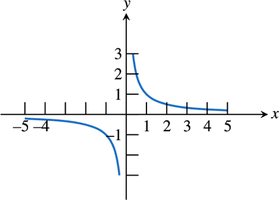
The Reciprocal Function
The reciprocal function is defined as . Its graph is a hyperbola with vertical and horizontal asymptotes.
Domain: All real numbers except
Range: All real numbers except
Graph: Two branches, one in each quadrant
Example:
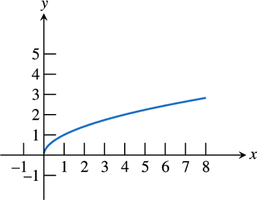
The Square Root Function
The square root function is defined as . It is only defined for non-negative values of .
Domain:
Range:
Graph: Starts at the origin and increases slowly
Example:
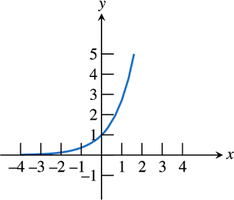
The Exponential Function
The exponential function is defined as , where is an irrational constant approximately equal to 2.71828.
Domain: All real numbers
Range:
Graph: Rapidly increases for positive
Example:
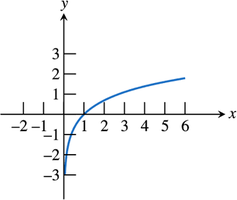
The Natural Logarithm Function
The natural logarithm function is defined as . It is the inverse of the exponential function.
Domain:
Range: All real numbers
Graph: Increases slowly, undefined for
Example:
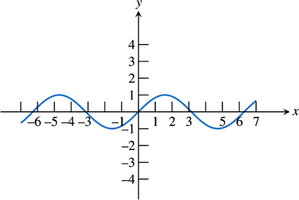
The Sine Function
The sine function is defined as . It is periodic and oscillates between -1 and 1.
Domain: All real numbers
Range:
Graph: Wave-like, repeats every
Example:
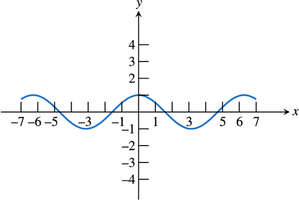
The Cosine Function
The cosine function is defined as . Like sine, it is periodic and oscillates between -1 and 1.
Domain: All real numbers
Range:
Graph: Wave-like, repeats every
Example:
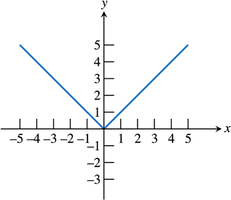
The Absolute Value Function
The absolute value function is defined as . It measures the distance of from zero.
Domain: All real numbers
Range:
Graph: V-shaped, with a corner at the origin
Example:
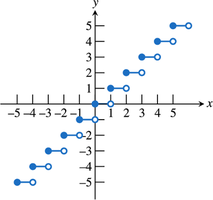
The Greatest Integer Function
The greatest integer function, also known as the floor function, is defined as . It returns the largest integer less than or equal to .
Domain: All real numbers
Range: All integers
Graph: Step-like, with jump discontinuities at integer values
Example:
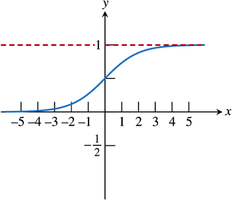
The Logistic Function
The logistic function is defined as . It models growth that is limited by a maximum value.
Domain: All real numbers
Range:
Graph: S-shaped curve with horizontal asymptotes at and
Example: