 Indietro
Inflation and Business Cycles: Step-by-Step Study Guidance
Guida di studio - Note intelligenti
 Appunti personalizzati basati sui tuoi materiali, ampliati con definizioni chiave, esempi e contesto.
Q1. Explain the Meaning, Features and Definitions of Inflation.
Background
Topic: Inflation (Macroeconomics)
This question tests your understanding of what inflation is, its key characteristics, and how various economists have defined it. It also explores the impact of inflation on the value of money and the economy as a whole.
Key Terms:
Inflation: A sustained and general increase in the price level of goods and services in an economy over time.
Purchasing Power: The amount of goods and services that can be bought with a unit of currency.
General Price Level: The average of current prices across the entire spectrum of goods and services produced in the economy.
Step-by-Step Guidance
Start by defining inflation in your own words, emphasizing the idea of a continuous and general rise in prices, not just a one-time or isolated increase.
Discuss the inverse relationship between the value of money and the price level: as prices rise, the value of money falls, and vice versa.
Summarize the definitions of inflation given by key economists (e.g., A.C. Pigou, G. Crowther, Paul Samuelson, Harry G. Johnson, Milton Friedman), noting the unique emphasis of each.
List and explain the main features of inflation, such as general rise in prices, sustained increase, fall in purchasing power, unequal effects, monetary and real causes, and effect on cost of living.
Use examples to illustrate how inflation affects purchasing power (e.g., how ₹100 buys fewer goods over time).
Try solving on your own before revealing the answer!
Final Answer:
Inflation is a sustained and general increase in the price level of goods and services in an economy, leading to a decrease in the purchasing power of money. Key features include a general rise in prices, continuous increase, fall in purchasing power, unequal effects on different groups, and both monetary and real causes. Definitions by economists highlight aspects such as the imbalance between money income and production (Pigou), the decline in the value of money (Crowther), and the rise in costs and prices (Samuelson). Inflation is a central macroeconomic issue because it affects all sectors of the economy and requires coordinated policy responses.
Q2. Explain the Types of Inflation.
Background
Topic: Types of Inflation
This question examines your knowledge of the different classifications of inflation based on causes and measurement, such as demand-pull, cost-push, core, headline, WPI, and CPI inflation.
Key Terms:
Demand-Pull Inflation: Inflation caused by an increase in aggregate demand.
Cost-Push Inflation: Inflation caused by an increase in the cost of production.
Core Inflation: Inflation excluding volatile items like food and fuel.
Headline Inflation: Overall inflation including all items.
WPI/CPI: Wholesale Price Index/Consumer Price Index, measures of inflation at wholesale and consumer levels.
Step-by-Step Guidance
Begin by listing the main types of inflation: demand-pull, cost-push, core, headline, WPI, and CPI inflation.
Define each type, focusing on what causes it or how it is measured.
Explain the importance of distinguishing between these types for economic policy and analysis.
Provide examples or scenarios where each type might occur.
Try solving on your own before revealing the answer!
Final Answer:
The main types of inflation are demand-pull (caused by excess demand), cost-push (caused by rising production costs), core (excluding volatile items), headline (including all items), WPI (measured at the wholesale level), and CPI (measured at the consumer level). Each type provides different insights into the causes and effects of inflation, which is important for designing effective policy responses.
Q3. Explain Demand-Pull Inflation and Its Causes.
Background
Topic: Demand-Pull Inflation
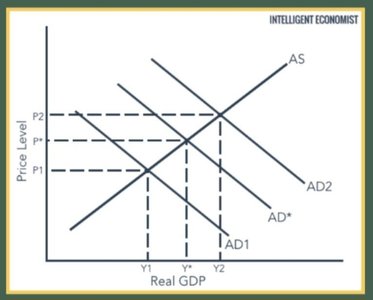
This question focuses on the concept of demand-pull inflation, which arises when aggregate demand in an economy outpaces aggregate supply, leading to a general rise in prices.
Key Terms and Diagram:
Aggregate Demand (AD): Total demand for goods and services in an economy.
Aggregate Supply (AS): Total supply of goods and services.
Demand-Pull Inflation: Inflation resulting from an increase in aggregate demand.
Step-by-Step Guidance
Define demand-pull inflation and explain the basic mechanism: aggregate demand increases faster than aggregate supply.
List the main causes: increase in money supply, deficit financing, credit creation, increase in exports, repayment of public debt, black money, population growth, increase in income, and government expenditure.
Use the AD-AS diagram to show how a rightward shift in the AD curve (from AD1 to AD2) leads to a higher price level (from P1 to P2) and increased output (from Y1 to Y2).
Discuss how, in the short run, increased demand can boost output and employment, but once capacity is reached, further demand mainly raises prices.
Try solving on your own before revealing the answer!
Final Answer:
Demand-pull inflation occurs when aggregate demand increases faster than aggregate supply, causing a general rise in prices. Causes include increased money supply, deficit financing, easy credit, higher exports, and population growth. The AD-AS diagram illustrates how a rightward shift in AD raises both the price level and output, especially when the economy is near full capacity.
Q4. Explain Cost-Push Inflation and Its Causes.
Background
Topic: Cost-Push Inflation
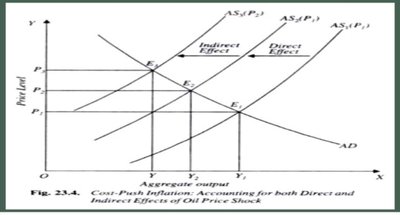
This question examines your understanding of cost-push inflation, which is driven by increases in the cost of production, leading to higher prices even if demand remains unchanged.
Key Terms and Diagram:
Cost-Push Inflation: Inflation caused by rising costs of production (e.g., wages, raw materials, fuel).
Aggregate Supply (AS): The total output of goods and services at different price levels.
Step-by-Step Guidance
Define cost-push inflation and explain how it differs from demand-pull inflation.
List the main causes: increase in wages, higher raw material costs, supply shocks, natural calamities, oil crises, monopoly power, and exchange-rate changes.
Use the AS-AD diagram to show how a leftward shift in the AS curve (from AS1 to AS2) leads to a higher price level (from P1 to P2) and lower output (from Y1 to Y2).
Discuss the economic consequences, such as stagflation (rising prices with falling output and employment).
Try solving on your own before revealing the answer!
Final Answer:
Cost-push inflation is caused by increases in production costs, such as wages and raw materials, which shift the aggregate supply curve leftward. This results in higher prices and lower output, as shown in the AS-AD diagram. Cost-push inflation can lead to stagflation, where inflation and unemployment rise together.
Q8. Explain the Trade-Off Between Inflation and Unemployment with the Phillips Curve.
Background
Topic: Phillips Curve (Inflation-Unemployment Trade-Off)
This question explores the relationship between inflation and unemployment, as depicted by the Phillips Curve, and discusses its implications for economic policy.
Key Terms and Diagram:
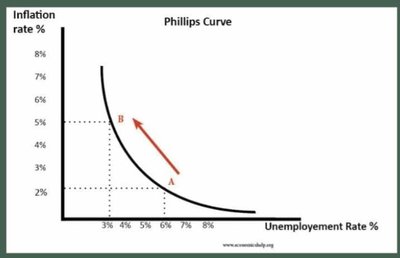
Phillips Curve: A graphical representation showing the inverse relationship between inflation and unemployment in the short run.
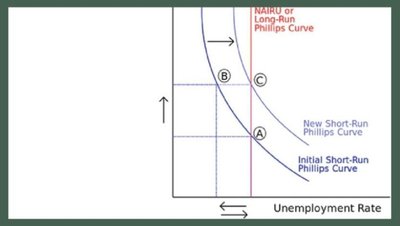
Short-Run vs. Long-Run: The trade-off may exist in the short run but not in the long run.
Step-by-Step Guidance
Define the Phillips Curve and explain its basic premise: as inflation rises, unemployment tends to fall, and vice versa (in the short run).
Describe the shape of the short-run Phillips Curve (downward sloping) and what it implies for policymakers.
Discuss how expansionary policies can move the economy along the curve (from point A to B), reducing unemployment at the cost of higher inflation.
Introduce the concept of the long-run Phillips Curve, which is vertical, indicating no permanent trade-off between inflation and unemployment.
Try solving on your own before revealing the answer!
Final Answer:
The Phillips Curve shows a short-run inverse relationship between inflation and unemployment, meaning lower unemployment can be achieved at the cost of higher inflation. However, in the long run, the curve becomes vertical, indicating no permanent trade-off. This has important implications for economic policy, as attempts to keep unemployment below its natural rate may only result in higher inflation over time.
Q13. Explain the Four Phases of a Trade Cycle with the help of a suitable diagram.
Background
Topic: Trade Cycle (Business Cycle)
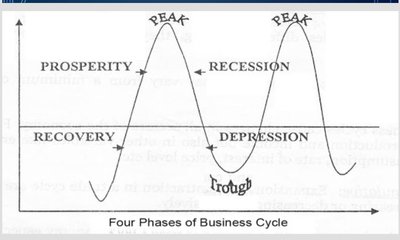
This question tests your understanding of the recurring phases of economic activity—prosperity, recession, depression, and recovery—and how they are represented in a business cycle diagram.
Key Terms and Diagram:
Trade Cycle/Business Cycle: The recurring pattern of expansion and contraction in economic activity.
Phases: Prosperity (expansion), Recession, Depression (trough), Recovery (revival).
Step-by-Step Guidance
List the four main phases: Prosperity, Recession, Depression, and Recovery.
Describe the key features of each phase (e.g., high output and employment in prosperity, falling demand and output in recession, low activity in depression, rising demand and output in recovery).
Use the business cycle diagram to illustrate how the economy moves through these phases in a wave-like pattern.
Explain how the completion of one phase sets the stage for the next, making the cycle self-reinforcing.
Try solving on your own before revealing the answer!
Final Answer:
The four phases of a trade cycle are Prosperity (expansion), Recession, Depression (trough), and Recovery. The business cycle diagram shows these phases as a wave-like movement of economic activity over time, with each phase leading to the next. Prosperity is marked by high output and employment, recession by declining activity, depression by low output and high unemployment, and recovery by rising activity and optimism.
