 Indietro
Chp. 2 prologue, Reading and evaluating Scientific research
Guida di studio - Note intelligenti
 Appunti personalizzati basati sui tuoi materiali, ampliati con definizioni chiave, esempi e contesto.
Prologue: Learning How to Learn
Learning Styles and Mindsets
Understanding how we learn is foundational to success in psychology and other academic disciplines. Research shows that effective learning involves using multiple formats and adopting a growth mindset.
Learning Styles Preferences: While individuals may have preferences (visual, auditory, kinesthetic), the most effective learning occurs when multiple formats are used together.
Fixed vs. Growth Mindset: A fixed mindset assumes abilities are static, while a growth mindset recognizes that ongoing effort leads to improvement and rewards.
Expert Recommendations: Cognitive scientists such as Dr. Stephen Chew and The Learning Scientists recommend evidence-based strategies like retrieval practice, spaced repetition, and elaboration for effective learning.
Application: Students are encouraged to use resources such as The Learning Scientists’ videos and downloadable materials to enhance their study habits.
Example: A student who reviews material in different formats (reading, discussing, practicing problems) and believes effort leads to improvement is more likely to succeed than one who relies on a single method and believes intelligence is fixed.
Chapter 2: Reading and Evaluating Scientific Research
Statistical Significance
Statistical significance is a key concept in evaluating psychological research. It helps determine whether observed differences between groups are likely due to the experimental manipulation or simply random chance.
Null Hypothesis (H0): Assumes any observed differences are due to chance.
Experimental Hypothesis (H1): Suggests differences are due to the variable controlled by the experimenter.
P-Value: The probability of obtaining results at least as extreme as those observed, assuming the null hypothesis is true. A result is typically considered statistically significant if p < 0.05.
Equation:
Example: If a new teaching method leads to higher test scores with p = 0.03, we conclude the method likely has a real effect.
Critical Evaluation of Statistical Significance
It is important to critically evaluate the use of statistical significance in research, considering factors that can influence results.
Multiple Comparisons: Testing many hypotheses increases the chance of finding a significant result by chance.
Large Sample Size: Large samples can make even trivial differences statistically significant.
Effect Sizes: Measures the magnitude of a finding, providing context beyond statistical significance.
Relevance: Statistical significance is a useful standard, but must be interpreted alongside effect size and study design.
Sharing and Replicating Results
Scientific research in psychology is disseminated and validated through several key processes.
Academic Journals: Research is published in peer-reviewed journals.
Peer Review: Experts evaluate the quality and validity of research before publication.
Replication: Other researchers attempt to reproduce findings to confirm their reliability.
Replication Crisis: Psychology has faced challenges with replicating some findings, highlighting the need for transparency and rigor.
5 Characteristics of Quality Scientific Research
High-quality psychological research shares several important characteristics:
Objective, Valid, and Reliable Measurements: Data collection methods must be unbiased, measure what they intend to, and produce consistent results.
Generalizability: Findings should apply beyond the specific sample studied.
Bias Reduction: Techniques such as randomization and blinding help minimize bias.
Public Availability: Research should be accessible to the scientific community and public.
Replicability: Other researchers should be able to repeat the study and obtain similar results.
Chapter 2: Reading and Evaluating Scientific Research
Introduction to Scientific Research in Psychology
Scientific research is the foundation of psychological science, providing systematic methods for investigating questions about behavior and mental processes. Understanding how to read and evaluate research is essential for interpreting findings and applying them to real-world situations.
Scientific Research Designs
Formulating Research Questions and Hypotheses
Research Question: The initial inquiry that guides the research process.
Hypothesis: A specific, testable prediction about the relationship between variables.
Research Design: The overall strategy for collecting and analyzing data to answer the research question.
Types of Research Methods
Descriptive Research: Involves gathering data to describe the current state of participants on a particular measure. Examples include case studies, naturalistic observation, and surveys.
Qualitative Research: Uses words or images as data, focusing on interpreting subjective, personal, or socially constructed meanings.
Quantitative Research: Involves numerical data and includes correlational and experimental methods.
Data Collection Techniques
Physiological Measurements: Such as functional magnetic resonance imaging (fMRI), blood, or saliva samples.
Naturalistic Observation: Observing behavior in its natural environment without interference.
Self-Reporting: Collecting data through questionnaires, interviews, or focus groups. Care must be taken to avoid bias and word questions carefully.
Correlational Research
Understanding Correlations
Correlational research examines the relationship between two variables without manipulating them. The strength and direction of the relationship are represented by a correlation coefficient (r), which ranges from -1 to +1.
Positive Correlation: As one variable increases, the other also increases.
Negative Correlation: As one variable increases, the other decreases.
Zero Correlation: No relationship between the variables.
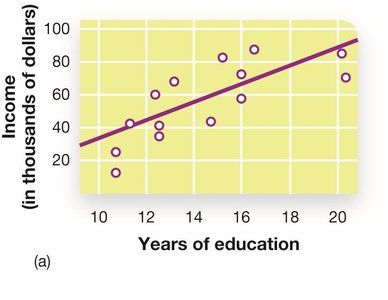
Example: A positive correlation might be found between years of education and income, while a negative correlation could exist between hours of sleep and irritability.
Experimental Research
The Experimental Method
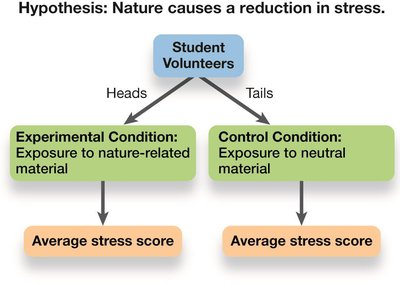
Experimental research involves manipulating one variable to determine its effect on another, allowing for causal conclusions.
Random Assignment: Participants are randomly assigned to groups to ensure each has an equal chance of being in any condition.
Experimental Group: Receives the treatment or stimulus targeting a specific behavior.
Control Group: Does not receive the treatment; serves as a baseline for comparison.
Quasi-Experimental Groups: Groups based on predetermined characteristics rather than random assignment.
Independent Variable (IV): The variable manipulated by the researcher.
Dependent Variable (DV): The variable measured to assess the effect of the IV.
Confounding Variables: Factors outside the researcher's control that might affect the results.
Between-Subjects Design: Compares different groups of participants.
Within-Subjects Design: Compares participants to themselves under different conditions.
Characteristics of Quality Scientific Research
Five Key Characteristics
Objective, Valid, and Reliable Measurements: Data must be collected using standardized, accurate, and consistent methods.
Generalizability: Findings should apply beyond the specific sample studied.
Reduction of Bias: Research should use techniques to minimize bias from researchers or participants.
Public Disclosure: Results should be shared openly, typically through academic journals and peer review.
Replicability: Other researchers should be able to repeat the study and obtain similar results.
Scientific Measurement: Objectivity, Reliability, and Validity
Objectivity: Measurements should be free from personal bias and based on observable phenomena.
Reliability: The consistency and stability of a measurement over time or across raters.
Inter-rater Reliability: Consistency between different observers.
Test-retest Reliability: Consistency over time.
Validity: The extent to which a measurement accurately reflects the concept it is intended to measure.
Operational Definitions: Specific explanations of how variables are measured in a study.
Generalizability of Results
Population: The entire group of interest.
Sample: The subset of the population studied.
Random Sample: Every member of the population has an equal chance of being selected.
Convenience Sample: Participants are selected based on ease of access.
Ecological Validity: The extent to which findings generalize to real-world settings.
Bias in Psychological Research
Sources of Bias
Researcher Bias: Expectations or preferences of the researcher influence the results.
Participant Bias: Participants alter their behavior due to awareness of being studied.
Hawthorne Effect: Changes in behavior resulting from the awareness of being observed.
Social Desirability: Participants respond in ways they believe are socially acceptable.
Demand Characteristics: Participants guess the purpose of the study and change their behavior accordingly.
Placebo Effect: Participants experience changes due to expectations rather than the treatment itself.
Techniques to Reduce Bias
Anonymity: Participants' identities are not linked to their data.
Confidentiality: Researchers keep participants' information private.
Single-Blind Study: Participants do not know which group they are in.
Double-Blind Study: Neither participants nor researchers know group assignments.
Sharing and Replicating Research
Dissemination and Replication
Academic Journals: Primary means of sharing research findings.
Peer Review: Evaluation of research by experts before publication.
Replication: Repeating studies to verify results; essential for scientific progress.
Replication Crisis: Recent concerns about the inability to replicate some psychological findings.
Poor Scientific Research Practices
Characteristics of Poor Research
Lack of Falsifiable Hypotheses: Hypotheses must be testable and capable of being disproven.
Anecdotal Evidence: Relying on personal stories rather than systematic data.
Biased Selection of Data: Choosing data that supports a particular conclusion while ignoring contrary evidence.
Appeal to Authority: Accepting claims based solely on the status of the person making them.
Appeal to Common Sense: Accepting claims because they seem obvious, without scientific evidence.
Summary Table: Quality vs. Poor Scientific Research
Quality Scientific Research | Poor Scientific Research |
|---|---|
Objective, valid, reliable measurements | Lack of falsifiable hypotheses |
Generalizable findings | Anecdotal evidence |
Reduces bias | Biased selection of data |
Results made public | Appeal to authority |
Can be replicated | Appeal to common sense |
Conclusion
Understanding how to read and evaluate scientific research is crucial for students of psychology. By recognizing the characteristics of quality research and being aware of common pitfalls, students can critically assess findings and contribute to the advancement of psychological science.
Chapter 2: Reading and Evaluating Scientific Research
The Scientific Method in Psychology
Psychological research relies on the scientific method to ensure objectivity and reliability. The process involves several key steps:
Research Question: Clearly defined question guiding the study.
Hypothesis: A testable prediction about the relationship between variables.
Research Design: The plan for collecting and analyzing data.
Types of Research Designs
Psychologists use various research designs to answer different types of questions:
Descriptive Research: Defines the current state of participants on a measure of interest. Examples include case studies, naturalistic observation, and surveys.
Qualitative Research: Uses words or images as data, focusing on subjective, personal, or socially constructed meanings.
Quantitative Research: Uses numerical data to examine relationships between variables. Includes correlational and experimental designs.
Data Collection Methods
Physiological Measurements: Recording biological data such as heart rate or brain activity.
Observation: Watching behavior in natural or controlled settings.
Self-Report: Questionnaires, interviews, and focus groups. Researchers must avoid bias and carefully word questions.
Correlational Research
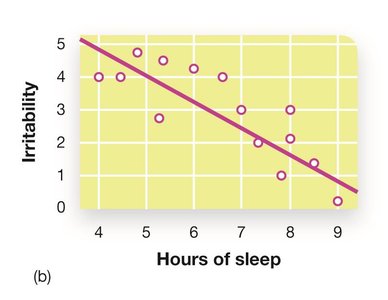
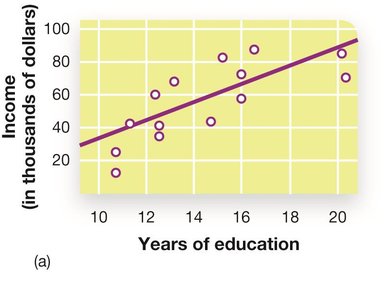
Correlational research examines the relationship between two variables without manipulating them. The strength and direction of the relationship are measured by the correlation coefficient (r), which ranges from -1 to +1.
Positive Correlation: As one variable increases, so does the other.
Negative Correlation: As one variable increases, the other decreases.
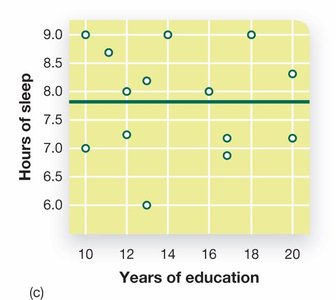
Zero Correlation: No relationship between the variables.
Type of Correlation | Example |
|---|---|
Positive | Years of education and income |
Negative | Hours of sleep and irritability |
Zero | Years of education and hours of sleep |
The Experimental Method
Experiments are used to determine cause-and-effect relationships by manipulating one variable and observing its effect on another.
Random Assignment: Participants are randomly assigned to groups to ensure equal chances and reduce bias.
Experimental Group: Receives the treatment or stimulus targeting a specific behavior.
Control Group: Does not receive the treatment; serves as a baseline for comparison.
Quasi-Experimental Groups: Based on predetermined characteristics (e.g., age, gender).
Independent Variable (IV): The variable manipulated by the experimenter.
Dependent Variable (DV): The variable measured to assess the effect of the IV.
Confounding Variables: Factors outside the researcher's control that may affect results.
Between-Subjects Design: Compares different groups of participants.
Within-Subjects Design: Compares participants to themselves under different conditions.
Example: Testing whether a new teaching method improves exam scores. The teaching method is the independent variable, and exam scores are the dependent variable. Random assignment ensures groups are comparable.
Summary Table: Key Research Methods in Psychology
Method | Description | Strengths | Limitations |
|---|---|---|---|
Descriptive | Describes current state or behavior | Rich detail, real-world context | No cause-effect conclusions |
Correlational | Examines relationships between variables | Can study variables that cannot be manipulated | Cannot infer causation |
Experimental | Manipulates variables to test effects | Can infer causation | May lack real-world generalizability |
