2. Describing Data with Tables and Graphs
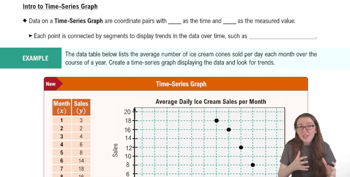
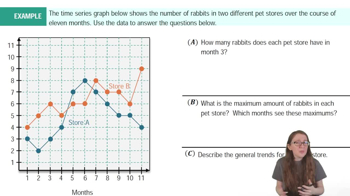
Time-Series Graph
2. Describing Data with Tables and Graphs
Time-Series Graph
 04:13


Esercitati su questo argomento
- Scelta multipla
The time-series graph below gives the price (USD) of a gallon of gas each month over the course of a year. Find the time intervals during which gas prices are increasing.
693views13rank - Scelta multipla
Which of the following charts provides a useful means for displaying data over time?
197views - Scelta multipla
A time series graph is useful for which of the following purposes?
171views - Scelta multipla
A time series plot is also known as a:
224views