Indietro

Applied Statistics Exam 2 Study Guide

Guida di studio - Impara con i video

Lezioni curate abbinate al materiale che hai caricato – impara ogni argomento passo dopo passo.

Bar Graphs and Pareto Charts

  • Percorso guidato
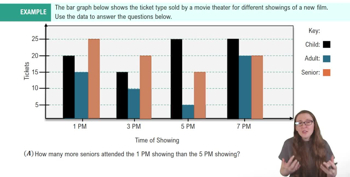
    Bar Graphs and Pareto Charts Example 1
    05:26
  • Percorso guidato
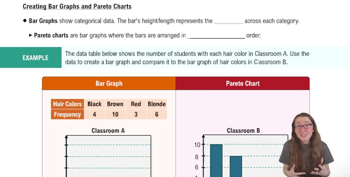
    Creating Bar Graphs and Pareto Charts
    04:52

Histograms

  • Percorso guidato
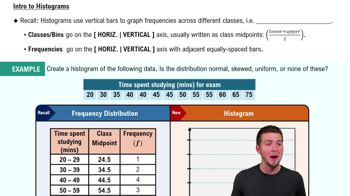
    Intro to Histograms
    05:54
  • Percorso guidato
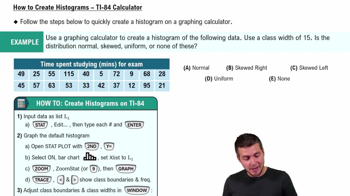
    How to Create Histogram - TI-84 Calculator
    07:10

Boxplots

  • Percorso guidato
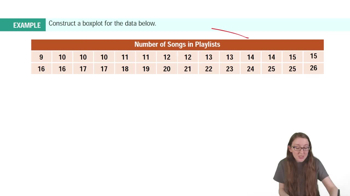
    Boxplots Example 1
    01:52
  • Percorso guidato
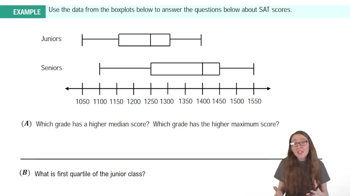
    Boxplots Example 2
    02:48
  • Percorso guidato
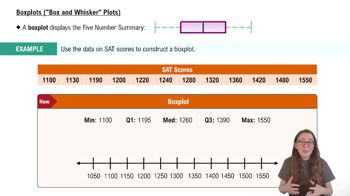
    Boxplots ("Box and Whisker Plots")
    03:54

Sampling Distribution of the Sample Mean and Central Limit Theorem

  • Percorso guidato
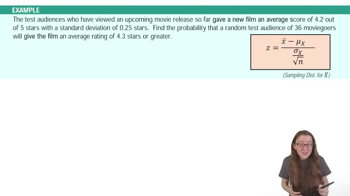
    Central Limit Theorem Example 1
    02:33
  • Percorso guidato
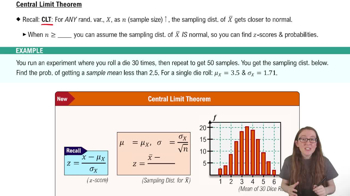
    Central Limit Theorem
    05:14
  • Percorso guidato
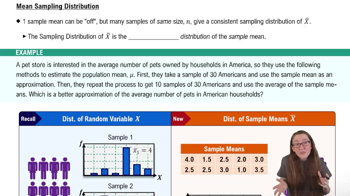
    Sampling Distribution of Sample Mean
    06:53

Introduction to Confidence Intervals

  • Percorso guidato
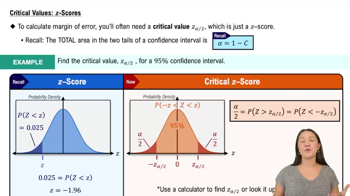
    Critical Values: z Scores
    04:46
  • Percorso guidato
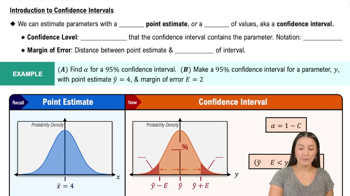
    Introduction to Confidence Intervals
    06:33

Confidence Intervals for Population Mean

  • Percorso guidato
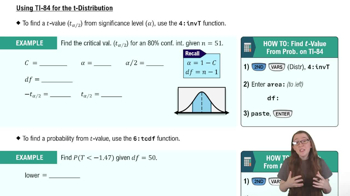
    Finding t-Values Using a TI-84
    05:47
  • Percorso guidato
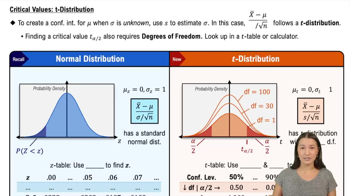
    Critical Values: t-Distribution
    05:50
  • Percorso guidato
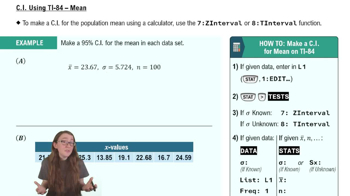
    Finding Confidence Intervals Using TI-84
    04:30

Steps in Hypothesis Testing

  • Percorso guidato
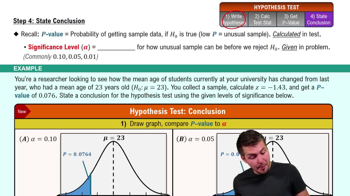
    Step 4: State Conclusion
    09:56
  • Percorso guidato
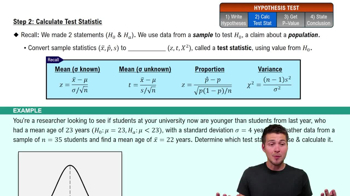
    Step 2: Calculate Test Statistic
    06:34
  • Percorso guidato
    Step 1: Write Hypotheses
    06:21

Type I & Type II Errors

  • Percorso guidato
    Type I & Type II Errors Example 1
    03:21
  • Percorso guidato
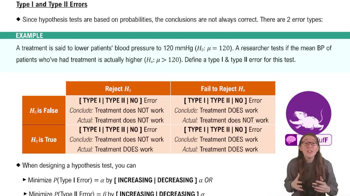
    Type I & Type II Errors
    06:02

Performing Hypothesis Tests: Means

  • Percorso guidato
    Standard Deviation (σ) Unknown Example 3
    05:55
  • Percorso guidato
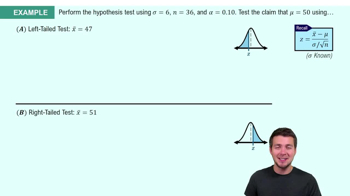
    Standard Deviation (σ) Known Example 1
    06:38
  • Percorso guidato
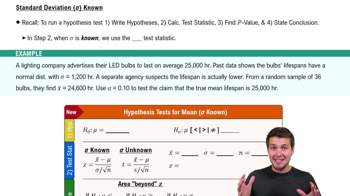
    Standard Deviation (σ) Known
    06:34

Performing Hypothesis Tests: Proportions

  • Percorso guidato
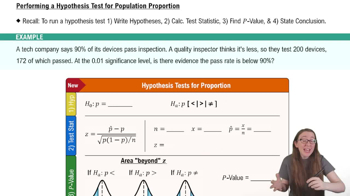
    Performing Hypothesis Tests: Proportions
    05:52
  • Percorso guidato
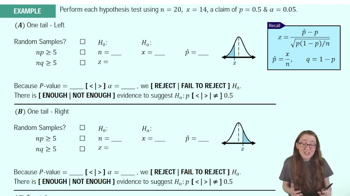
    Performing Hypothesis Tests: Proportions Example 1
    07:06
  • Percorso guidato
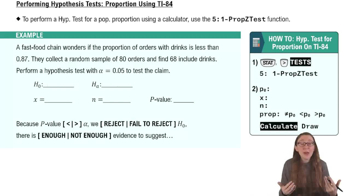
    Performing Hypothesis Tests: Proportions Using TI-84
    03:32

Chi Square Distribution

  • Percorso guidato
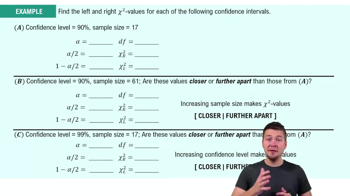
    Critical Values: Chi Square Distribution Example 2
    05:18
  • Percorso guidato
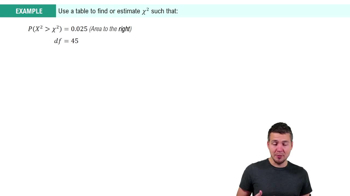
    Critical Values: Chi Square Distribution Example 1
    03:55
  • Percorso guidato
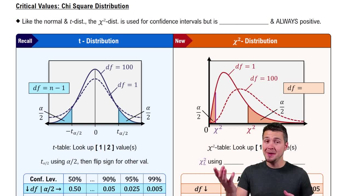
    Critical Values: Chi Square Distribution
    05:39

Introduction to Contingency Tables

  • Percorso guidato
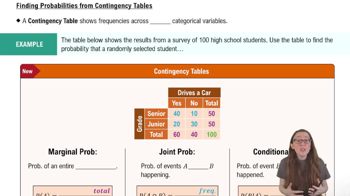
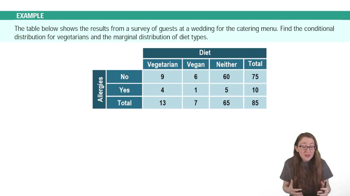
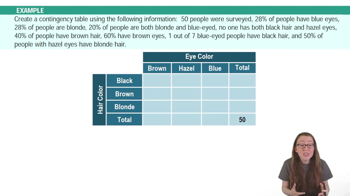
    Introduction to Contingency Tables
    05:35
  • Percorso guidato
    Introduction to Contingency Tables Example 2
    03:05
  • Percorso guidato
    Introduction to Contingency Tables Example 1
    04:15

Basic Concepts of Probability

  • Percorso guidato
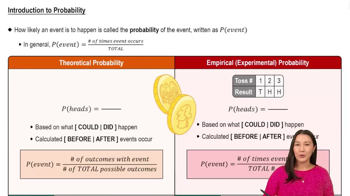
    Introduction to Probability
    5:37

Multiplication Rule: Independent Events

  • Percorso guidato
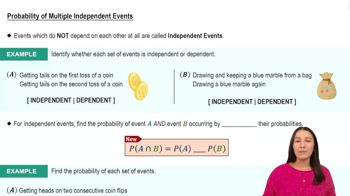
    Probability of Multiple Independent Events
    05:54

Bayes' Theorem

  • Percorso guidato
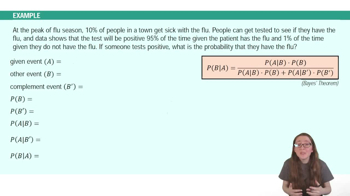
     Bayes' Theorem Example 1
    02:32
  • Percorso guidato
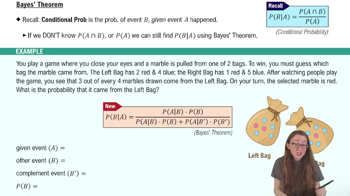
    Bayes' Theorem
    05:10

Correlation Coefficient

  • Percorso guidato
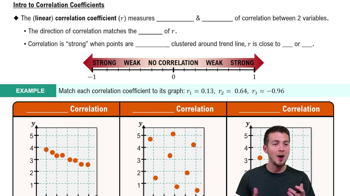
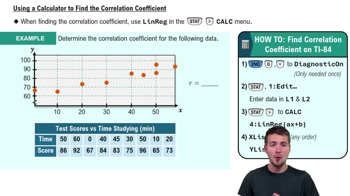
    Correlation Coefficient
    05:43
  • Percorso guidato
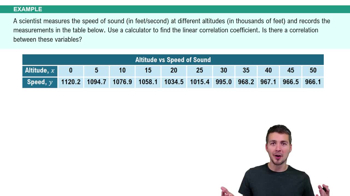
    Calculating Correlation Coefficient - Graphing Calculator
    04:40
  • Percorso guidato
    Calculating Correlation Coefficient - Graphing Calculator Example 1
    03:44

Hypothesis Tests for Correlation Coefficient Using TI-84

  • Percorso guidato
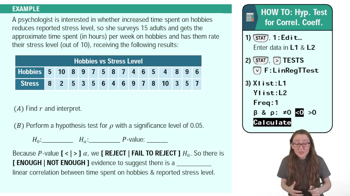
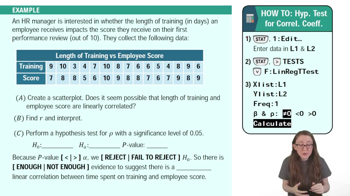
    Hypothesis Tests for Correlation Coefficient Using TI-84 Example 1
    03:39
  • Percorso guidato
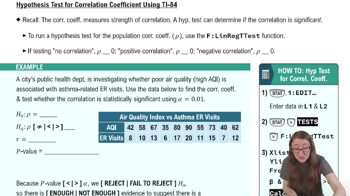
    Hypothesis Tests for Correlation Coefficient Using TI-84
    05:28
  • Percorso guidato
    Hypothesis Tests for Correlation Coefficient Using TI-84 Example 2
    06:24