 Indietro
Chapter 1: Data Collection and Introduction to Statistics
Guida di studio - Note intelligenti
 Appunti personalizzati basati sui tuoi materiali, ampliati con definizioni chiave, esempi e contesto.
Data Collection and Introduction to Statistics
Statistics and Statistical Thinking
Statistics is the science of collecting, organizing, summarizing, and analyzing information to draw conclusions or answer questions. It also involves providing a measure of confidence in any conclusions. The information used in statistics is called data, which describes characteristics of individuals and exhibits variability. Understanding and describing sources of variability is a central goal of statistics.
Statistics: The science of data analysis and interpretation.
Data: Facts or propositions used to draw conclusions or make decisions.
Variability: The tendency of data to differ among individuals or over time.
Statistical thinking: Recognizing the importance of data variability and the need for careful data collection and analysis.
The Process of Statistics
The statistical process consists of four main steps, each essential for drawing reliable conclusions from data:
Identify the research objective: Clearly define the question(s) to be answered and the population to be studied.
Collect the data: Gather information from a sample, as studying the entire population is often impractical.
Describe the data: Use descriptive statistics to summarize and organize the data, often through numerical summaries, tables, and graphs.
Perform inference: Apply inferential statistics to extend sample results to the population and report the reliability of the conclusions.
Descriptive statistics involve summarizing data, while inferential statistics use sample data to make generalizations about a population.
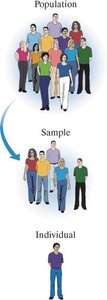
Population: The entire group of individuals to be studied.
Sample: A subset of the population selected for study.
Individual: A single member of the population.
Parameter: A numerical summary of a population.
Statistic: A numerical summary based on a sample.
Example: If the proportion of all students on campus who have a job is 0.849, this is a parameter. If a sample of 250 students yields a proportion of 0.864, this is a statistic.
Distinguishing Between Qualitative and Quantitative Variables
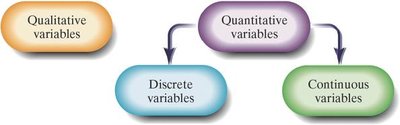
Variables are characteristics of individuals within a population. They can be classified as qualitative or quantitative:
Qualitative (Categorical) Variables: Allow for classification based on attributes or characteristics (e.g., education level, internet provider).
Quantitative Variables: Provide numerical measures that can be meaningfully added or subtracted (e.g., age, income).
Example: Education level is qualitative; daily intake of whole grains (grams per day) is quantitative.
Distinguishing Between Discrete and Continuous Variables
Quantitative variables can be further classified as discrete or continuous:
Discrete Variables: Have a finite or countable number of possible values (e.g., number of students in a classroom).
Continuous Variables: Have an infinite number of possible values within a range (e.g., income in dollars, sleep duration).
Example: Number of vending machines is discrete; grade earned in Algebra (percentage) is continuous.
Levels of Measurement of Variables
Variables can be measured at different levels, which determine the types of statistical analyses that can be performed:
Nominal: Values name, label, or categorize without a ranked order (e.g., internet provider).
Ordinal: Values can be arranged in a ranked or specific order (e.g., response to a survey: strongly agree, agree, disagree).
Interval: Differences between values have meaning; zero does not indicate absence (e.g., temperature in Celsius).
Ratio: Ratios of values have meaning; zero indicates absence (e.g., income in dollars, number of students).
Example: Income (in dollars) is ratio; grade earned in Algebra (percentage) is interval; internet provider is nominal; survey response is ordinal.
Summary Table: Types and Levels of Variables
Variable | Type | Discrete/Continuous | Level of Measurement |
|---|---|---|---|
Internet provider | Qualitative | N/A | Nominal |
Income (in dollars) | Quantitative | Continuous | Ratio |
Grade earned in Algebra (%) | Quantitative | Continuous | Interval |
Survey response (agree/disagree) | Qualitative | N/A | Ordinal |
Number of students | Quantitative | Discrete | Ratio |
Key Formulas
Sample Mean:
Sample Standard Deviation:
Proportion:
Additional info: Academic context and examples were expanded for clarity and completeness. The diagrams included directly illustrate the concepts of population/sample/individual and the classification of variables, reinforcing the explanations provided.
