 Indietro
Chapter 1: Data Collection and Introduction to Statistics
Guida di studio - Note intelligenti
 Appunti personalizzati basati sui tuoi materiali, ampliati con definizioni chiave, esempi e contesto.
Chapter 1: Data Collection
1.1 Introduction to the Practice of Statistics
Statistics is the science of collecting, organizing, analyzing, and interpreting data in order to make decisions. The practice of statistics involves understanding variability in data and applying statistical thinking to draw meaningful conclusions. Data are measurements or observations that vary among individuals or over time.
Statistics: The science of learning from data, including collection, analysis, interpretation, and presentation.
Statistical Thinking: Recognizing variability in data and understanding the process of making inferences from data.
Data: Information collected from observations, measurements, or responses.
Variability: The tendency of data to differ from one individual or observation to another.
One goal of statistics is to understand and explain variability in data.
Population, Sample, and Individual
In statistics, it is important to distinguish between the population, sample, and individual:
Population: The entire group of individuals or objects to be studied.
Sample: A subset of the population selected for study.
Individual: A single member of the population.
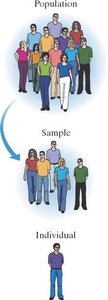
Descriptive Statistics: Methods for summarizing and organizing data using numerical summaries, tables, and graphs.
Inferential Statistics: Methods for making generalizations from a sample to a population and measuring the reliability of those generalizations.
Parameter: A numerical summary of a population.
Statistic: A numerical summary based on a sample.
Example: If the proportion of all students on campus who have a job is 0.849, this is a parameter. If a sample of 250 students yields a proportion of 0.864, this is a statistic.
The Process of Statistics
The statistical process consists of four main steps:
Identify the research objective: Define the question(s) and population to be studied.
Collect the data: Gather information needed to answer the research question, often from a sample.
Describe the data: Summarize and organize the data using descriptive statistics.
Perform inference: Apply statistical methods to extend sample results to the population and report reliability.
Example: In a study of high school student sleeping patterns, researchers investigated the association between school start time and sleep duration using a sample of 383 adolescents. They described the data and concluded that later start times were associated with longer sleep duration.
Variables in Statistics
Distinguishing Between Qualitative and Quantitative Variables
Variables are characteristics or properties that can take on different values among individuals. Understanding the type of variable is essential for choosing appropriate statistical methods.
Qualitative (Categorical) Variables: Variables that describe qualities or categories (e.g., gender, education level, name of university).
Quantitative Variables: Variables that provide numerical measures (e.g., height, daily intake of whole grains, number of vending machines).
Example:
Education level – Qualitative
Today’s high temperature – Quantitative
Daily intake of whole grains – Quantitative
Number of vending machines – Quantitative
Whether a student is prepared for class – Qualitative
Number of days per week a student eats lunch – Quantitative
Name of a university – Qualitative
Discrete and Continuous Variables
Quantitative variables can be further classified as discrete or continuous:
Discrete Variables: Quantitative variables with a finite or countable number of possible values (e.g., number of children in a classroom).
Continuous Variables: Quantitative variables with an infinite number of possible values within a given range (e.g., height, gas mileage).
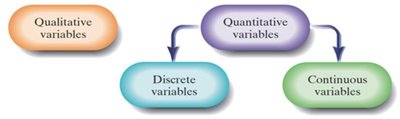
Example:
Gender – Qualitative
Income status – Qualitative
Income – Quantitative (Continuous)
Grade earned in Algebra (percentage) – Quantitative (Continuous)
Response to attitude question – Qualitative
Number of children in a classroom – Quantitative (Discrete)
Data Types and Observations
The list of values a variable assumes is called data. Qualitative data are observations corresponding to qualitative variables (e.g., Ford, Chevrolet, BMW for car manufacturer). Quantitative data are observations corresponding to quantitative variables (e.g., 13 mpg, 21 mpg for gas mileage).
Discrete Data: Observations from discrete variables.
Continuous Data: Observations from continuous variables.
Additional info: Understanding the classification of variables is fundamental for selecting appropriate statistical techniques and interpreting results accurately.
