 Indietro
Chapter 1: Data Collection in Introductory Statistics
Guida di studio - Note intelligenti
 Appunti personalizzati basati sui tuoi materiali, ampliati con definizioni chiave, esempi e contesto.
Data Collection in Statistics
Definition and Process of Statistics
Statistics is the science of collecting, organizing, summarizing, and drawing conclusions from data about groups. The process of statistics involves three main steps:
Collecting useful data about the group of interest.
Organizing and summarizing the data into a useful form, known as descriptive statistics.
Making conclusions about the group based on the refined data, known as inferential statistics.
General Terminology
Understanding key terms is essential for studying statistics:
Data: The information collected for analysis.
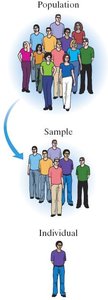
Population: The entire group being studied.
Parameter: A numerical summary of a population.
Individual: A single object or person within a population.
Sample: A subset of the population.
Statistic: A numerical summary of a sample.
Variable: The characteristics of individuals studied in a population.
Variables
Variables are the characteristics measured in statistics. They can be classified as follows:
Constant: A variable with only one value in the population.
Qualitative (Categorical) Variable: A characteristic without a numeric measurement (e.g., color, gender).
Quantitative Variable: A characteristic with a numeric measurement (e.g., height, age).
Discrete Quantitative Variable: Has gaps between possible values (e.g., number of children).
Continuous Quantitative Variable: Has no gaps between possible values (e.g., weight).
Response Variable: The variable studied to see how it changes in response to other variables (dependent variable).
Explanatory Variable: The variable thought to explain changes in the response variable (independent variable).
Sampling Methods
Sampling and Random Sampling
Sampling is the process of selecting a subset (sample) from a population to make inferences about the whole group. Random sampling methods help ensure the sample is representative:
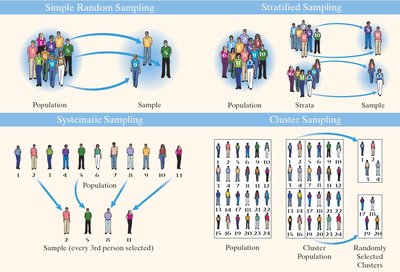
Simple Random Sample (SRS): Every individual has an equal chance of being selected.
Frame: A list of all individuals in the population, required for SRS.
Sampling Frame: The list from which the sample is actually drawn.
Random Sampling Methods
There are several random sampling methods used in statistics:
Stratified Sample: Population is divided into disjoint groups (strata), and a SRS is taken from each stratum.
Cluster Sample: Population is divided into groups (clusters), a SRS of clusters is taken, and all individuals in selected clusters are included.
Systematic Sample: Randomly select an individual, then select every kth individual thereafter.
Non-Random Sampling Methods
Non-random sampling methods do not use random processes and may introduce bias:
Convenience Sample: Composed of easily obtained individuals.
Voluntary Response Sample: Individuals choose to participate.
Quota Sampling: Sample is forced to be representative by fulfilling quotas for certain groups.
Sample Size and Proportion
Sample size (n) is the number of individuals in a sample. Sampling proportion is the ratio of sample size to population size:
Sample Size:
Population Size:
Sampling Proportion:
Bias and Error in Sampling
Bias
Bias occurs when a sample does not accurately represent the population. Main sources of bias include:
Sampling Bias: Sample selection favors one part of the population.
Non-response Bias: Some individuals do not participate, and their responses differ from those who do.
Response Bias: Inaccurate responses on surveys.
Types of Error
Non-sampling Error: Caused by bias in the sample.
Sampling Variability: Natural diversity in possible samples.
Sampling Error: Error from using a sample to estimate population parameters, ideally caused by sampling variability.
Correlation and Causation
Correlation
Correlation refers to a numeric relationship between variables. Causation means one variable directly causes changes in another. It is important to note:
Correlation does not imply causation.
Studies and Experiments
Observational Studies vs. Designed Experiments
Data can be collected through passive observation or active manipulation:
Observational Study: Measures variables without impacting their values.
Designed Experiment: Manipulates explanatory variables to measure their impact on the response variable.
Types of Observational Study
Cross-sectional Study: Collects data at a specific point in time.
Case-control Study: Uses past data from similar individuals.
Cohort Study: Collects data from a sample over time.
Confounding and Lurking Variables
Confounding occurs when multiple explanatory variables influence the same response variable, making it difficult to distinguish their effects. A lurking variable is a confounding variable not considered in the study. Observational studies can only establish correlation, not causation.
Designed Experiments and Features
Designed experiments control explanatory variables to minimize confounding. Key features include:
Experimental Units: Individuals in the experiment; called subjects if human.
Control Group: Receives baseline or no treatment for comparison.
Placebo: Fake treatment to control for psychological effects.
Placebo Effect: Improvement due to belief in treatment.
Single-blinded Experiment: Subjects do not know which treatment they receive.
Double-blinded Experiment: Neither subjects nor researchers know who receives which treatment.
Experiment Design Types
Completely Randomized Design: Each unit is randomly assigned a treatment.
Matched-pairs Design: Units are paired; one receives treatment, the other receives a different treatment or none.
Randomized Block Design: Units are grouped into blocks of similar units; within each block, units are randomly assigned treatments.
