 Indietro
Chapter 1: Data Collection – Introductory Statistics Study Guide
Guida di studio - Note intelligenti
 Appunti personalizzati basati sui tuoi materiali, ampliati con definizioni chiave, esempi e contesto.
Chapter 1: Data Collection
1.1 Introduction to the Practice of Statistics
Statistics is the science of collecting, organizing, summarizing, and analyzing information to draw conclusions or answer questions. It also provides a measure of confidence in any conclusions. The information used in statistics is called data, which describes characteristics of individuals and exhibits variability.
Statistics: The science of data analysis and interpretation.
Statistical Thinking: Understanding and accounting for variability in data.
Data: Facts or propositions used to draw conclusions or make decisions.
Variability: The tendency of data to differ among individuals or over time.
1.1.2 The Process of Statistics
The process of statistics involves several key steps: identifying the population, collecting data, describing the data, and performing inference.
Population: The entire group of individuals to be studied.
Sample: A subset of the population being studied.
Individual: A single member of the population.
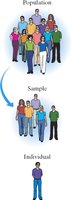
Descriptive Statistics: Organizing and summarizing data using numerical summaries, tables, and graphs.
Inferential Statistics: Methods that use sample results to make generalizations about the population and measure reliability.
Parameter: Numerical summary of a population.
Statistic: Numerical summary based on a sample.
Example: If 84.9% of all students have a job (parameter) and 86.4% of a sample of 250 students have a job (statistic), the sample size is 250.
Steps in the Process of Statistics
Identify the research objective.
Collect the data needed to answer the question.
Describe the data using descriptive statistics.
Perform inference to extend sample results to the population and report reliability.
1.1.3 Qualitative vs. Quantitative Variables
Variables are characteristics of individuals within the population. They can be classified as qualitative or quantitative.
Qualitative (Categorical) Variables: Classify individuals based on attributes or characteristics.
Quantitative Variables: Provide numerical measures of individuals; values can be added or subtracted meaningfully.
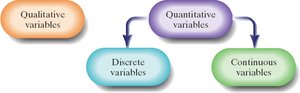
Example: Nationality (qualitative), Number of children (quantitative), Household income (quantitative), Level of education (qualitative), Daily intake of whole grains (quantitative).
1.1.4 Discrete vs. Continuous Variables
Quantitative variables can be further classified as discrete or continuous.
Discrete Variable: Has a finite or countable number of possible values (e.g., number of children).
Continuous Variable: Has an infinite number of possible values and can be measured to any desired level of accuracy (e.g., household income, daily intake of whole grains).
Example: Number of children (discrete), Household income (continuous), Daily intake of whole grains (continuous).
The type of variable dictates the methods used to analyze the data.
1.1.5 Levels of Measurement
Variables can be measured at different levels, which determine the types of statistical analyses that can be performed.
Nominal: Values name, label, or categorize; no ranking (e.g., hair color, zip code).
Ordinal: Values can be ranked; differences between values are not meaningful (e.g., letter grades).
Interval: Differences between values have meaning; zero does not indicate absence (e.g., temperature in Fahrenheit).
Ratio: Ratios of values have meaning; zero indicates absence (e.g., height, age).
Variable | Nominal | Ordinal | Interval | Ratio |
|---|---|---|---|---|
Hair Color | Yes | No | No | No |
Zip Code | Yes | No | No | No |
Letter Grade | Yes | Yes | No | No |
ACT Score | Yes | Yes | Yes | No |
Height | Yes | Yes | Yes | Yes |
Age | Yes | Yes | Yes | Yes |
Temperature (F) | Yes | Yes | Yes | No |
1.2 Observational Studies vs. Designed Experiments
Observational studies and designed experiments are two main approaches to data collection.
Observational Study: Measures the value of the response variable without influencing the outcome.
Designed Experiment: Researcher assigns individuals to groups, manipulates explanatory variables, and records response variables.
Example: Studying cell phone use and brain tumors by tracking individuals over time (observational study) vs. exposing rats to radio frequencies (designed experiment).
Confounding Variable: An explanatory variable whose effect cannot be distinguished from another.
Lurking Variable: Not considered in the study but affects the response variable.
Observational studies can only claim association, not causation.
Types of Observational Studies
Cross-sectional: Collects information at a specific point in time.
Case-control: Retrospective; compares individuals with and without certain characteristics.
Cohort: Prospective; follows a group over time.
Census: List of all individuals in a population with their characteristics.
1.3 Simple Random Sampling
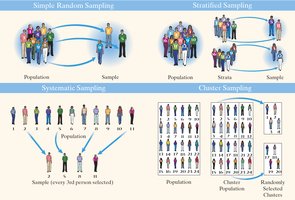
Simple random sampling ensures every possible sample of size n from a population of size N has an equally likely chance of occurring.
Random Sampling: Using chance to select individuals for the sample.
Frame: List of all individuals in the population.
Random Number Table: Used to generate random samples.
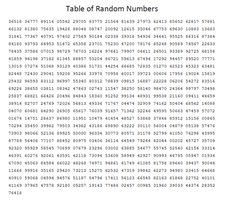
Example: To select 5 members from 435, number them and use a random number generator to select the sample.
1.4 Other Effective Sampling Methods
There are several sampling methods besides simple random sampling:
Stratified Sample: Divide population into homogeneous strata and sample from each stratum.
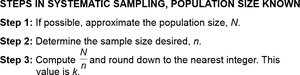
Systematic Sample: Select every kth individual from the population after a random start.
Cluster Sample: Select all individuals within randomly chosen groups.
Convenience Sample: Individuals are easily obtained; results are often unreliable.
Multistage Sampling: Combines multiple sampling techniques.
1.5 Bias in Sampling
Bias occurs when the sample is not representative of the population. There are several sources of bias:
Sampling Bias: Technique favors one part of the population.
Nonresponse Bias: Individuals who do not respond differ from those who do.
Response Bias: Survey answers do not reflect true feelings due to interviewer error, misrepresented answers, wording, or order of questions.
Data-entry Error: Mistakes in recording data.
Nonsampling Error: Errors from bias or data-entry mistakes.
Sampling Error: Error from using a sample to estimate population information.

1.6 The Design of Experiments
Experiments are controlled studies to determine the effect of explanatory variables on a response variable.
Treatment: Combination of values of factors.
Experimental Unit: Person, object, or item receiving treatment.
Control Group: Baseline for comparison.
Placebo: Inactive treatment used for comparison.
Blinding: Nondisclosure of treatment received.
Single-blind: Subject does not know treatment.
Double-blind: Neither subject nor researcher knows treatment.
Steps in Designing an Experiment
Identify the problem and response variable.
Determine factors affecting the response variable.
Determine the number of experimental units.
Determine the level of predictor variables (control and randomization).
Conduct the experiment (replication and data collection).
Test the claim using inferential statistics.
Completely Randomized Design
Each experimental unit is randomly assigned to a treatment.
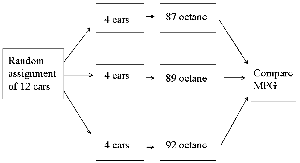
Example: Assigning 12 cars to three octane levels to compare miles per gallon.
Matched-Pairs Design
Experimental units are paired based on related characteristics, and each pair receives two levels of treatment.
Example: 75 children taste milk with and without Xylitol; order of tasting is randomized to avoid order effects.
Double-blind: Recommended to prevent bias.
