 Indietro
Chapter 1: Introduction to Statistics – Study Notes
Guida di studio - Note intelligenti
 Appunti personalizzati basati sui tuoi materiali, ampliati con definizioni chiave, esempi e contesto.
Introduction to Statistics
1-1 Statistical and Critical Thinking
Statistics is the science of collecting, organizing, analyzing, and interpreting data to make informed decisions. Critical thinking is essential in statistics, as it involves evaluating the validity of data, methods, and conclusions.
Data: Collections of observations, such as measurements, genders, or survey responses.
Statistics: The science of planning studies and experiments; obtaining data; and organizing, summarizing, presenting, analyzing, and interpreting those data to draw conclusions.
Population: The complete collection of all measurements or data being considered, typically the group about which we want to draw conclusions.
Census: The collection of data from every member of a population.
Sample: A subcollection of members selected from a population, used to draw conclusions about the population.
Example: In a survey of 410 human resource professionals, 148 said job candidates were disqualified due to social media postings. Here, the population is all human resource professionals, and the sample is the 410 surveyed.
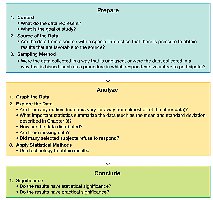
Statistical Study Process: Prepare, Analyze, Conclude
The process of conducting a statistical study involves three main steps: prepare, analyze, and conclude. Each step requires careful planning and critical thinking to ensure valid results.
Prepare: Define the context, identify the source of data, and determine the sampling method.
Analyze: Graph and explore the data, and apply appropriate statistical methods.
Conclude: Interpret the results, distinguishing between statistical and practical significance.
1-2 Types of Data
Understanding the types of data is crucial for selecting appropriate statistical methods and interpreting results accurately.
Qualitative (Categorical) Data: Consists of names or labels that are not numbers representing counts or measurements.
Quantitative (Numerical) Data: Consists of numbers representing counts or measurements.
Additional info: Quantitative data can be further classified as discrete (countable values) or continuous (measurable values).
1-3 Collecting Sample Data
How data are collected greatly affects the validity of statistical conclusions. Proper sampling methods are essential to avoid bias.
Random Sampling: Every member of the population has an equal chance of being selected.
Voluntary Response Sample: Also known as a self-selected sample, where respondents decide whether to participate. This method is prone to bias and should be avoided for making population inferences.
Example: Internet, mail-in, and call-in polls are common voluntary response samples and often yield biased results. A random sample, even if smaller, is more reliable than a large voluntary response sample.
Statistical and Critical Thinking
Potential Pitfalls in Data Analysis
Several pitfalls can undermine the validity of statistical analyses. Awareness of these issues helps ensure accurate and meaningful conclusions.
Misleading Conclusions: Conclusions should be clear and understandable, avoiding technical jargon when possible.
Sample Data Reported Instead of Measured: Direct measurements are preferred over self-reported data to reduce bias.
Loaded Questions: Poorly worded survey questions can bias results.
Order of Questions: The sequence of questions can influence responses.
Nonresponse: Occurs when selected individuals do not respond, potentially biasing results.
Low Response Rates: Decrease reliability and increase the risk of bias.
Misleading Percentages: Percentages should not exceed 100% unless justified; otherwise, they may mislead.
Drawing Conclusions: Statistical vs. Practical Significance
Statistical Significance
Statistical significance is achieved if the likelihood of an event occurring by chance is 5% or less. For example, getting 98 girls in 100 random births is statistically significant, while 52 girls in 100 births is not.
Practical Significance
Even if a result is statistically significant, it may not be practically significant. Practical significance considers whether the result is large enough to be meaningful in real-world terms.
Example: In a weight loss study, a statistically significant average loss of 2.1 kg may not be practically significant for dieters who expect greater results.
Summary Table: Census vs. Sample
Term | Definition | Example |
|---|---|---|
Census | Data from every member of a population | Surveying all human resource professionals |
Sample | Data from a subset of the population | Surveying 410 human resource professionals |
