 Indietro
Chapter 3: Numerically Summarizing Data – Study Guide
Guida di studio - Note intelligenti
 Appunti personalizzati basati sui tuoi materiali, ampliati con definizioni chiave, esempi e contesto.
Numerically Summarizing Data
Measures of Central Tendency
Measures of central tendency are statistical values that describe the center of a data set. The three most common measures are the mean, median, and mode.
Mean: The arithmetic mean is the sum of all values divided by the number of observations. It is sensitive to extreme values.
Median: The median is the middle value when data are arranged in ascending order. It is resistant to outliers.
Mode: The mode is the most frequently occurring value in the data set. A data set may have no mode, one mode, or multiple modes.
Example Table:
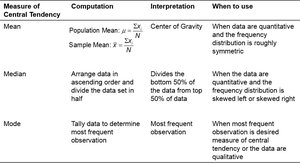
Measure of Central Tendency | Computation | Interpretation | When to use |
|---|---|---|---|
Mean | Population Mean: Sample Mean: | Center of Gravity | Quantitative data, symmetric distribution |
Median | Arrange data, divide in half | Divides bottom 50% from top 50% | Skewed distributions |
Mode | Tally most frequent observation | Most frequent observation | Qualitative data or when mode is desired |
Arithmetic Mean
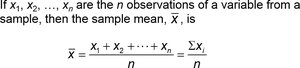
The mean is calculated differently for populations and samples:
Population Mean ():
Sample Mean ():
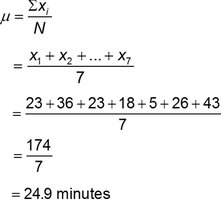
Example: For the data set 23, 36, 23, 18, 5, 26, 43:
Population mean: minutes
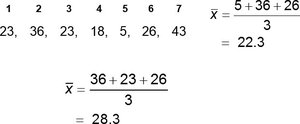
Sample means from random samples:
Sample 1:
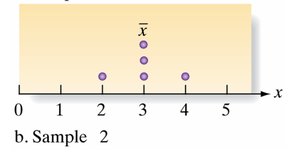
Sample 2:
Median
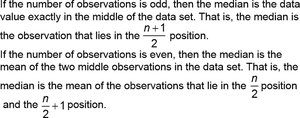
The median is the value in the middle of the data set when arranged in order. If the number of observations is odd, the median is the middle value. If even, it is the mean of the two middle values.
Example (Odd n): For n = 7, the median is the 4th value:
Sorted data: 5, 18, 23, 23, 26, 36, 43
Median: 23

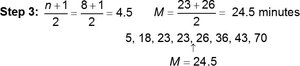
Example (Even n): For n = 8, the median is the mean of the 4th and 5th values:
Sorted data: 5, 18, 23, 23, 26, 36, 43, 70
Median:
Resistant Statistics
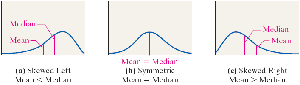
A statistic is resistant if it is not affected substantially by extreme values. The median is resistant, while the mean is not.
Example: Changing an extreme value in the data set affects the mean but not the median.
Measures of Dispersion
Dispersion measures describe the spread of data values. Common measures include range, variance, and standard deviation.
Range:
Variance: The average squared deviation from the mean.
Standard Deviation: The square root of the variance.
Standard Deviation
The standard deviation quantifies the amount of variation in a data set.
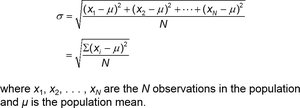
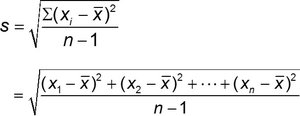
Population Standard Deviation ():
Sample Standard Deviation ():
Example Table:
x | x - mean | (x - mean)^2 |
|---|---|---|
2 | -1 | 1 |
3 | 0 | 0 |
4 | 1 | 1 |
Sum: , | ||
Empirical Rule
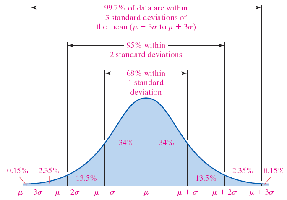
The Empirical Rule applies to bell-shaped (normal) distributions:
68% of data within 1 standard deviation of the mean
95% within 2 standard deviations
99.7% within 3 standard deviations
Chebyshev’s Inequality
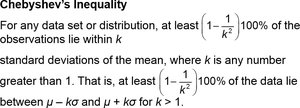
Chebyshev’s Inequality applies to any data set, regardless of shape. It states that at least of the data lies within k standard deviations of the mean, for .
Grouped Data: Mean and Standard Deviation
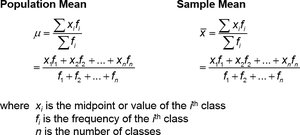
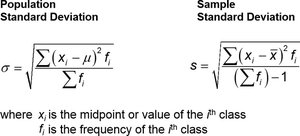
When data are grouped, the mean and standard deviation can be approximated using frequency distributions.
Population Mean:
Sample Mean:
Population Standard Deviation:
Sample Standard Deviation:
Weighted Mean
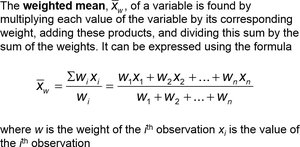
The weighted mean is used when different values have different weights:
Measures of Position and Outliers
Measures of position describe the relative standing of a data value within a data set.
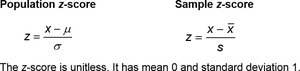
z-score: Indicates how many standard deviations a value is from the mean. (population), (sample)
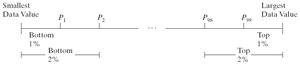
Percentiles: Divide data into 100 equal parts.
Quartiles: Divide data into four equal parts.
Interquartile Range (IQR):
Outliers: Values outside or

Five-Number Summary and Boxplots
The five-number summary consists of the minimum, Q1, median, Q3, and maximum. Boxplots visually display this summary and help identify outliers and the shape of the distribution.
Boxplot: Drawn using the five-number summary and fences for outliers.
Example: For credit card interest rates: 6.5%, 9.9%, 12.0%, 13.0%, 13.3%, 13.9%, 14.3%, 14.4%, 14.4%, 14.5% Five-number summary: 6.5%, 12.0%, 13.6%, 14.4%, 14.5%
Summary
Numerical summaries are essential for understanding data sets. Measures of central tendency and dispersion provide insight into the data's center and spread, while measures of position and boxplots help interpret relative standing and distribution shape.
