 Indietro
Confidence Intervals in Introductory Statistics: Mean, Proportion, Variance, and Standard Deviation
Guida di studio - Note intelligenti
 Appunti personalizzati basati sui tuoi materiali, ampliati con definizioni chiave, esempi e contesto.
Confidence Intervals
Introduction to Confidence Intervals
Confidence intervals are fundamental tools in statistics for estimating population parameters based on sample data. They provide a range of plausible values for the parameter, along with a specified level of confidence.
Point Estimate: A single value estimate for a population parameter, such as the sample mean (x̅) for the population mean (μ).
Interval Estimate: A range of values used to estimate a population parameter, reflecting uncertainty due to sampling variability.
Level of Confidence (c): The probability that the interval estimate contains the population parameter, assuming repeated sampling.
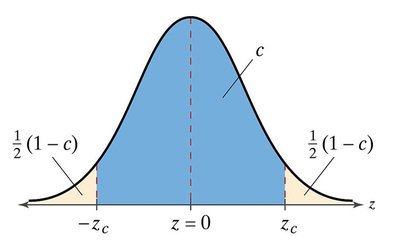
Critical Values and Confidence Levels
Critical values separate probable from improbable sample statistics. For a given confidence level, the critical value (zc or tc) determines the endpoints of the confidence interval.
Standard Normal Distribution: Used when the population standard deviation (σ) is known.
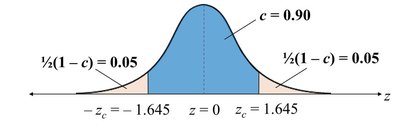
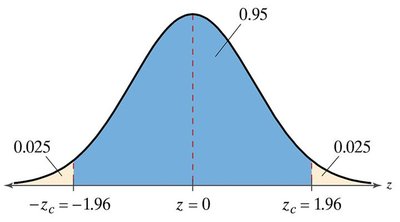
Common Confidence Levels: 90% (zc = 1.645), 95% (zc = 1.96), 99% (zc = 2.575).
Confidence Intervals for the Mean (μ): σ Known
Constructing Confidence Intervals
When the population standard deviation is known, the confidence interval for the mean is constructed using the standard normal distribution.
Margin of Error (E):
Confidence Interval:
Conditions: Random sample, population is normally distributed or .
Example: Athletic Activities
A sample of 40 student-athletes yields a sample mean of 19.6 hours. With σ = 1.2 and a 95% confidence level:
Margin of error:
Confidence interval: or

Using Technology
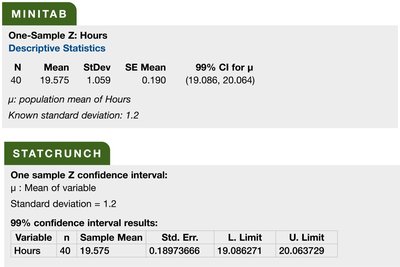
Statistical software (e.g., Minitab, StatCrunch, TI-84 Plus) can compute confidence intervals efficiently.
Interpretation
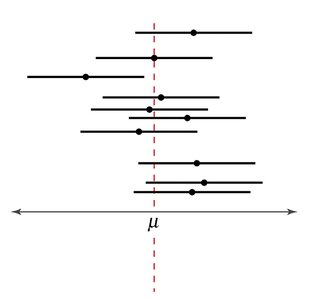
The confidence interval does not state the probability that μ is in the interval, but rather that, in repeated sampling, the interval will contain μ in approximately c% of cases.
Minimum Sample Size
To achieve a desired margin of error E at confidence level c:
Round up to the next whole number.
Confidence Intervals for the Mean (μ): σ Unknown
The t-Distribution
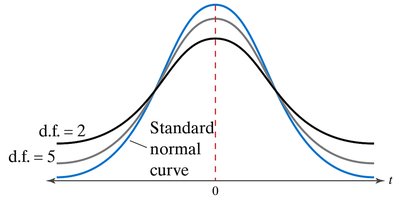
When σ is unknown, use the t-distribution, which accounts for additional uncertainty from estimating σ with the sample standard deviation (s).
Degrees of Freedom (d.f.):
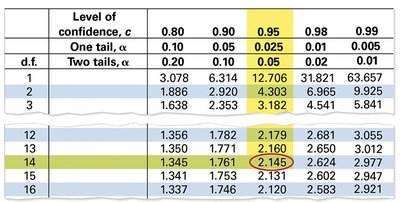
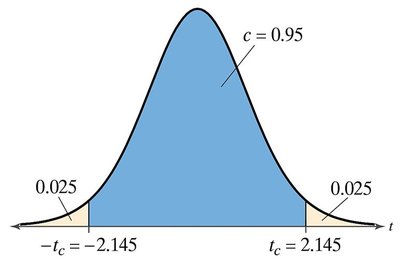
Critical Value (tc): Found using t-tables or technology.
Margin of Error:
Confidence Interval:
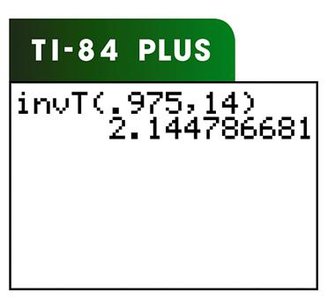
Example: Coffee Shop Temperatures
Sample of 16 coffee shops, sample mean 162.0°F, s = 10.0, 95% confidence:
Margin of error:
Confidence interval: or
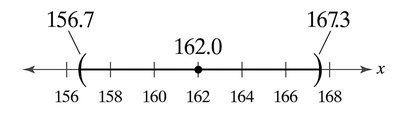
Example: Car Dealership Days
Sample of 36 cars, sample mean 9.75 days, s = 2.39, 99% confidence:
Margin of error:
Confidence interval:

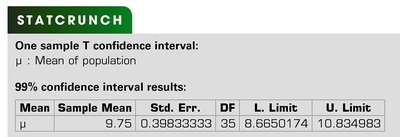
Choosing Between Normal and t-Distribution
Use the standard normal distribution if σ is known and the population is normal or . Use the t-distribution if σ is unknown.
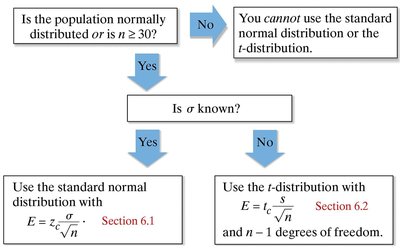
Confidence Intervals for Population Proportions (p)
Point Estimate for Proportion
The sample proportion (p̂) is the best estimate for the population proportion (p).
, where x = number of successes, n = sample size
, proportion of failures
Constructing Confidence Intervals for Proportion
Conditions: , (normal approximation)
Margin of Error:
Confidence Interval:
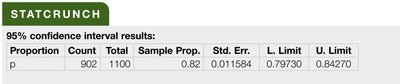
Example: Summer Travel
902 out of 1100 adults plan to travel. , , 95% confidence:
Margin of error:
Confidence interval:

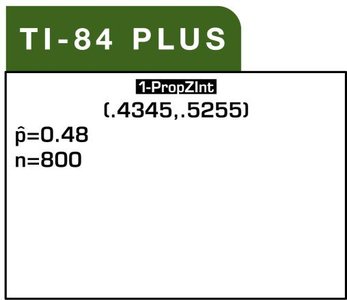
Example: News Preferences
48% of 800 adults prefer news websites/social media. , , 99% confidence:
Margin of error:
Confidence interval:


Minimum Sample Size for Proportion
If no preliminary estimate, use

Confidence Intervals for Variance (σ2) and Standard Deviation (σ)
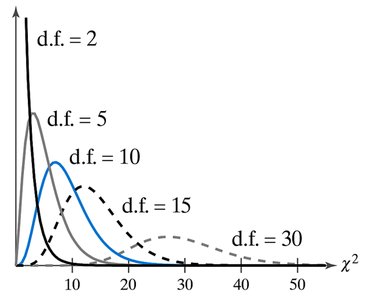
The Chi-Square Distribution
Used to construct confidence intervals for variance and standard deviation when the population is normally distributed.
Degrees of Freedom:
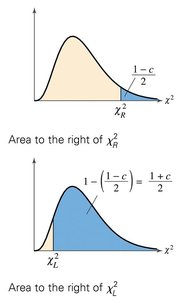
Critical Values: (left-tail), (right-tail)
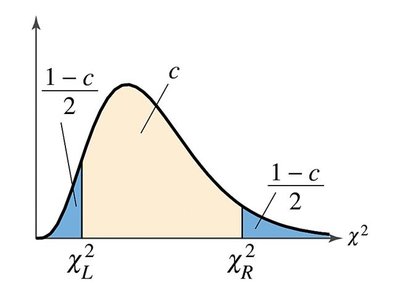
Constructing Confidence Intervals
Variance:
Standard Deviation:
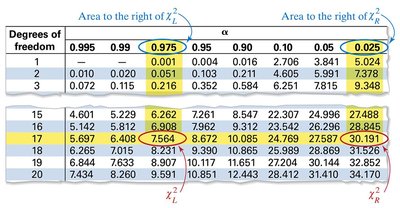
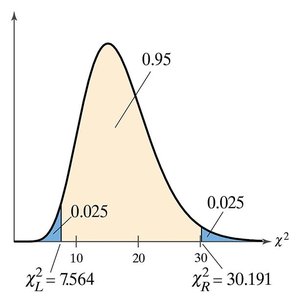
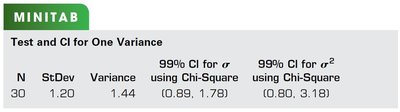
Example: Allergy Medicine Weights
Sample of 30, s = 1.20 mg, 99% confidence:
Variance interval:
Standard deviation interval:
Summary Table: Confidence Interval Formulas
Parameter | Distribution | Formula |
|---|---|---|
Mean (μ), σ known | Normal (z) | |
Mean (μ), σ unknown | t-distribution | |
Proportion (p) | Normal (z) | |
Variance (σ2) | Chi-square | |
Standard Deviation (σ) | Chi-square |
