 Indietro
Correlation and Regression: Study Notes for Introductory Statistics
Guida di studio - Note intelligenti
 Appunti personalizzati basati sui tuoi materiali, ampliati con definizioni chiave, esempi e contesto.
Correlation and Regression
Section 9.1: Correlation
Correlation is a fundamental concept in statistics that describes the relationship between two variables. Understanding correlation helps us determine whether changes in one variable are associated with changes in another. This section covers the types of correlation, how to measure correlation, and the distinction between correlation and causation.
Correlation: A relationship between two variables, represented by ordered pairs (x, y).
Independent Variable (x): Also called the explanatory variable; plotted on the horizontal axis.
Dependent Variable (y): Also called the response variable; plotted on the vertical axis.
Scatter Plots
A scatter plot is a graphical tool used to visualize the relationship between two quantitative variables. Each point represents an ordered pair (x, y).
Positive Linear Correlation: As x increases, y tends to increase.
Negative Linear Correlation: As x increases, y tends to decrease.
No Correlation: No apparent relationship between x and y.
Nonlinear Correlation: Relationship exists but is not linear.
Example: GDP and Carbon Dioxide Emissions
Scatter plot of GDP vs. CO2 emissions for 10 countries shows a positive linear correlation: as GDP increases, CO2 emissions tend to increase.
Example: Exercise Hours and GPA
Scatter plot of weekly exercise hours vs. GPA shows no linear correlation: exercise hours do not appear related to GPA.
Example: Geyser Eruptions
Scatter plot of eruption duration vs. time until next eruption shows a positive linear correlation: longer eruptions are followed by longer intervals until the next eruption.
Correlation Coefficient
The correlation coefficient (r) quantifies the strength and direction of a linear relationship between two variables.
Sample correlation coefficient: r
Population correlation coefficient: \( \rho \)
Range: \( -1 \leq r \leq 1 \)
Interpretation:
r = 1: Perfect positive correlation
r = -1: Perfect negative correlation
r = 0: No linear correlation
Values closer to 1 or -1 indicate stronger correlation
Formula for r:
Example: Calculating r for GDP and CO2 Emissions
Using the formula and data, the calculated r suggests a strong positive linear correlation.
Using Technology to Find Correlation Coefficient
Statistical software and calculators can quickly compute the correlation coefficient.
Excel: Use =CORREL(A1:A25,B1:B25) to find r for eruption durations and times.
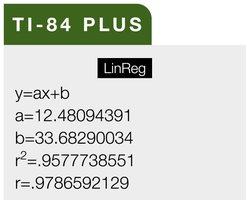
TI-84 Plus: Linear regression output provides r and r2.
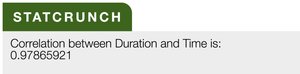
StatCrunch: Directly reports the correlation between variables.

Testing the Significance of the Correlation Coefficient
After calculating r, it is important to determine if the observed correlation is statistically significant. This can be done using critical values from a table or by performing a hypothesis test.
Critical Value Table: Compare r to the critical value for the given sample size and significance level.
Significance: If |r| > critical value, the correlation is significant.
Example: Using Table 11 for Old Faithful Data
With n = 25 and a 5% significance level, the critical value is 0.396. Since r = 0.9787 > 0.396, the correlation is significant.
Hypothesis Testing for the Population Correlation Coefficient
A hypothesis test can formally assess whether the sample correlation coefficient provides enough evidence to conclude that the population correlation coefficient is significant.
Null Hypothesis (H0): \( \rho = 0 \) (no correlation)
Alternative Hypothesis (H1): \( \rho \neq 0 \) (correlation exists)
Test Statistic: t-distribution with n - 2 degrees of freedom
Example: t-Test for Correlation Coefficient
For n = 10, calculate t and compare to critical values. If t falls in the rejection region, reject H0 and conclude significant correlation.
Correlation vs. Causation
It is crucial to understand that correlation does not imply causation. Even if two variables are strongly correlated, it does not mean that one causes the other.
Direct cause-and-effect: x causes y
Reverse cause-and-effect: y causes x
Lurking variables: Other variables may influence both x and y
Coincidence: The relationship may be due to chance
Summary Table: Types of Correlation
Type | Description | r Value |
|---|---|---|
Perfect Positive | As x increases, y increases in a perfectly linear fashion | 1 |
Strong Positive | As x increases, y increases; points closely follow a line | 0.81 |
Weak Positive | As x increases, y increases; points loosely follow a line | 0.45 |
Perfect Negative | As x increases, y decreases in a perfectly linear fashion | -1 |
Strong Negative | As x increases, y decreases; points closely follow a line | -0.81 (inferred) |
No Correlation | No relationship between x and y | 0.04 |
Additional info: Strong negative correlation r value inferred as -0.81 for completeness.
