 Indietro
Defining and Collecting Data: Introductory Statistics Study Notes
Guida di studio - Note intelligenti
 Appunti personalizzati basati sui tuoi materiali, ampliati con definizioni chiave, esempi e contesto.
Defining and Collecting Data
Introduction to Statistics
Statistics is the science of collecting, organizing, summarizing, and analyzing information to draw conclusions or answer questions. It also involves providing a measure of confidence in any conclusions drawn from data.
Key Point: Statistics helps in making informed decisions based on data.
Key Point: It is essential for understanding variability and uncertainty in data.
Example: Using survey data to estimate the average income of a population.
Classifying Variables
Types of Variables
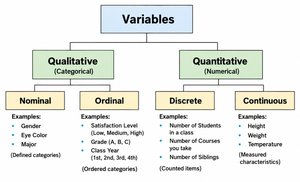
Variables are characteristics of individuals within a population. They are classified as qualitative (categorical) or quantitative (numerical).
Qualitative (Categorical) Variables: Take categories as values (e.g., "yes", "no", "blue", "brown").
Quantitative (Numerical) Variables: Represent counted or measured quantities.
Discrete Variables: Arise from a counting process (e.g., number of courses taken).
Continuous Variables: Arise from a measuring process (e.g., height, weight).
Example: Age (quantitative), Gender (qualitative), GPA (quantitative).
Measurement Scales
Measurement scales determine how variables are categorized and interpreted. There are four main types:
Nominal Scale: Classifies data into distinct categories without implied ranking (e.g., gender, eye color).
Ordinal Scale: Classifies data into categories with implied ranking (e.g., satisfaction level: low, medium, high).
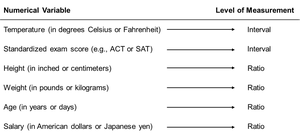
Interval Scale: Ordered scale where differences between measurements are meaningful, but no true zero (e.g., temperature in Celsius).
Ratio Scale: Ordered scale with meaningful differences and a true zero point (e.g., height, weight, salary).
Populations and Samples
Population vs. Sample
A population contains all items or individuals of interest, while a sample is a subset of the population.
Population: All individuals/items about which conclusions are to be drawn.
Sample: A portion of the population used for analysis.
Individual: A member of the population being studied.
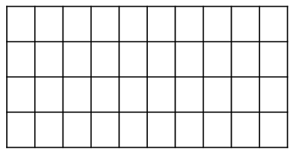
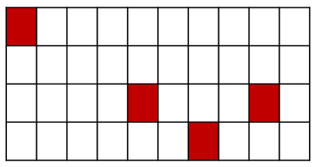
Example: Population of 40 students; sample of 4 students.
Parameters and Statistics
A population parameter summarizes the value of a variable for the entire population, while a sample statistic summarizes the value for the sample. Sample statistics are used to estimate population parameters.
Parameter: True value for the population (e.g., population mean).
Statistic: Calculated value from the sample (e.g., sample mean).
Example: Estimating average height of all students using a sample.
Sources of Data
Primary vs. Secondary Sources
Data can be collected from primary or secondary sources.
Primary Source: Data collector uses the data for analysis (e.g., experiment, survey).
Secondary Source: Data is analyzed by someone other than the collector (e.g., census data, published journals).
Example: Conducting a political survey (primary); analyzing published census data (secondary).
Sampling Techniques
Simple Random Sampling
Simple random sampling gives every individual/item an equal chance of being selected. Selection can be with or without replacement.
Key Steps: Number individuals, randomly select numbers, form sample.
Example: Randomly selecting 10 students from a population of 100.
Formula: Probability of selection where is sample size and is population size.
Systematic Sampling
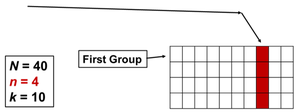
Systematic sampling selects every kth individual from the population after a random start.
Key Steps: Decide sample size , divide population size into groups of , randomly select one from first group, then every kth thereafter.
Example: If , , , select one from first group, then every 10th individual.
Stratified Sampling
Stratified sampling divides the population into homogeneous subgroups (strata) and selects a simple random sample from each stratum.
Key Steps: Divide population by characteristic, select random sample from each subgroup, combine samples.
Example: Stratifying voters by race or socioeconomic status.
Cluster Sampling
Cluster sampling divides the population into clusters, randomly selects clusters, and samples all or some individuals within those clusters.
Key Steps: Divide population into clusters, randomly select clusters, sample all or some within clusters.
Example: Election exit polls using selected districts.

Comparing Sampling Methods
Each sampling method has advantages and disadvantages depending on the population structure and research goals.
Simple Random Sampling: Best for homogeneous populations.
Systematic Sampling: Efficient for ordered lists.
Stratified Sampling: Ensures representation from each subgroup.
Cluster Sampling: Useful for geographically dispersed populations.
Chapter Summary
This chapter covered the definition and classification of variables, measurement scales, population and sample concepts, sources of data, and various sampling techniques. Understanding these foundational concepts is essential for collecting and analyzing data in statistics.
