Indietro
Describing, Exploring, and Comparing Data: Measures of Center and Variation
Guida di studio - Note intelligenti
 Appunti personalizzati basati sui tuoi materiali, ampliati con definizioni chiave, esempi e contesto.
Mean
Definition and Calculation
The mean (also known as the "average") is a measure of center that summarizes a data set with a single central value. It is calculated by adding all values in the data set and dividing by the total number of values.
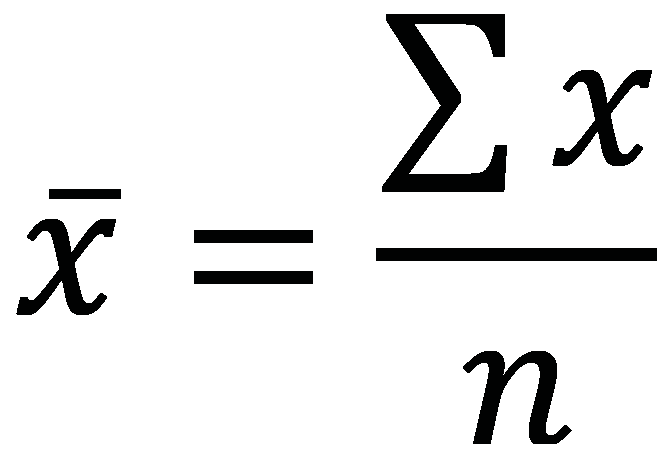
Formula: , where is the sample mean, is the sum of all values, and is the number of values.
The mean uses all values in the data set, making it sensitive to extreme values (outliers).
Mean is best used when the data is symmetric and does not contain outliers.
Example
Find the mean of the sample data: {5, 10, 12, 14, 3}
Sum: 5 + 10 + 12 + 14 + 3 = 44
Number of values: 5
Mean:
Median
Definition and Calculation
The median is another measure of center, representing the middle value when the data is sorted from smallest to largest. If the number of values is odd, the median is the middle value; if even, it is the average of the two middle values.
Median is less affected by outliers and skewed data than the mean.
Median is best used when the data is skewed or contains outliers.
Example
Find the median of the sample data: {5, 10, 12, 14, 3}
Sorted data: {3, 5, 10, 12, 14}
Median: 10 (middle value)
Median from a Histogram
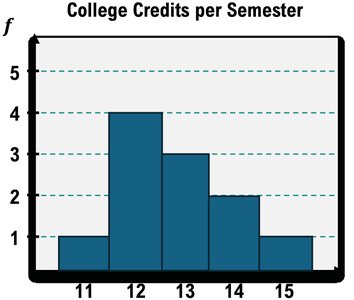
The histogram below shows the number of college credits a sample of students are taking in a given semester. The median can be found by identifying the middle value in the sorted data.
Mean vs. Median: Pros and Cons
Comparison
Mean: Uses all values; not resistant to outliers; best for symmetric data without outliers.
Median: Uses only the middle value(s); resistant to outliers; best for skewed data or data with outliers.
Mode
Definition and Calculation
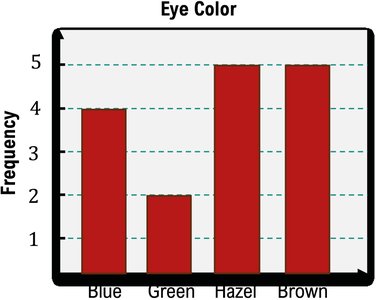
The mode is the value(s) that appear most frequently in a data set. It can be used for both quantitative and qualitative data.
Unimodal: One mode
Bimodal: Two modes
Multimodal: Three or more modes
Example
Find the mode(s) of the following data:
Quantitative: {0, 0, 0, 2, 2, 3, 4, 1, 2, 2, 0, 4, 1, 3, 0}
Mode: 0 and 2 (bimodal)
Standard Deviation
Definition and Calculation
Standard deviation is a measure of variation that quantifies how spread out the values in a data set are. A higher standard deviation indicates more spread.
For samples, use ; for populations, use .
Standard deviation is always non-negative ().
Standard deviation is sensitive to outliers.
Formula
The sample standard deviation can be calculated using:

Example
Find the mean and standard deviation of the sample {5, 10, 12, 14, 3, 4}:
Mean:
Standard deviation: (rounded)
Comparing Spread Using Histograms
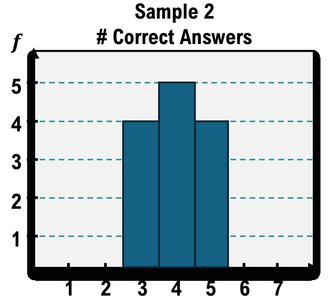
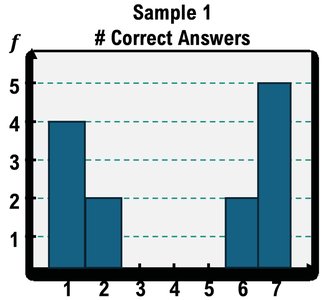
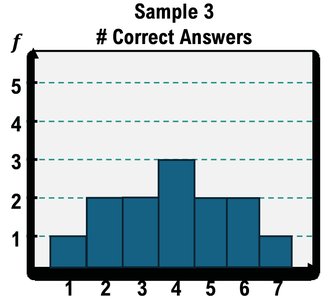
Without calculation, the spread of data can be visually compared using histograms. Samples with values concentrated near the mean have lower standard deviation, while samples with values spread out have higher standard deviation.
Describing Data Numerically Using a Graphing Calculator
Five-Number Summary and Calculator Steps
For large data sets, calculators can be used to quickly compute the mean, median, standard deviation, and quartiles. The five-number summary includes minimum, Q1, median, Q3, and maximum.
Enter data into list (L1)
Use the STAT function and select 1-Var Stats
Interpret calculator output for sample or population statistics



Interpreting Standard Deviation: Empirical Rule
Empirical Rule
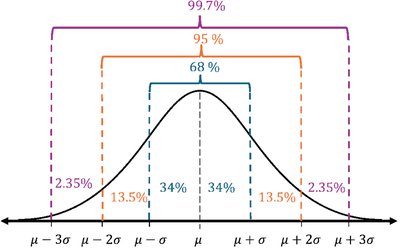
The Empirical Rule applies to bell-shaped (normal) distributions and states:
About 68% of data falls within 1 standard deviation of the mean
About 95% within 2 standard deviations
About 99.7% within 3 standard deviations
Percentiles and Quartiles
Definition and Calculation
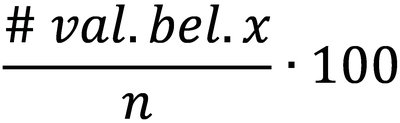
A percentile indicates the percentage of values in a dataset below a given value. Quartiles divide the data into four equal parts:
Q1: 25th percentile
Q2: 50th percentile (median)
Q3: 75th percentile
Interquartile Range (IQR): Difference between Q3 and Q1
Percentile formula:
Boxplots (Box and Whisker Plots)
Definition and Construction
A boxplot visually displays the five-number summary: minimum, Q1, median, Q3, and maximum. It is useful for comparing distributions and identifying outliers.
Boxplots show the spread and center of data
Whiskers extend to minimum and maximum values

Comparing Boxplots
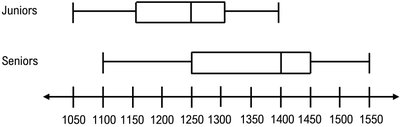
Boxplots can be used to compare groups, such as SAT scores for juniors and seniors. Key comparisons include median, range, and quartiles.