 Indietro
Describing, Exploring, and Comparing Data: Measures of Relative Standing and Boxplots
Guida di studio - Note intelligenti
 Appunti personalizzati basati sui tuoi materiali, ampliati con definizioni chiave, esempi e contesto.
Measures of Relative Standing and Boxplots
z Scores
The z score (also called the standard score or standardized value) is a measure that describes the position of a data value relative to the mean of the data set, expressed in terms of standard deviations. It is a key tool for comparing values from different data sets or distributions.
Definition: The z score for a value x is the number of standard deviations x is above or below the mean.
Formula (Sample):
Formula (Population):
Interpretation:
z > 0: Value is above the mean
z < 0: Value is below the mean
z = 0: Value equals the mean
Significance: Values with z ≤ −2 or z ≥ 2 are considered significantly low or high, respectively.
Round-off Rule: Round z scores to two decimal places.
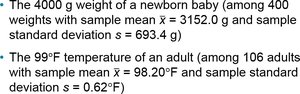

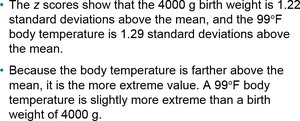
Example: Comparing a baby's birth weight (4000 g) and an adult's body temperature (99°F) using z scores allows us to determine which value is more extreme relative to its data set. The z scores show which value is farther from the mean in terms of standard deviations.
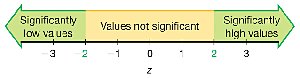
Example: Determining if a platelet count of 75 (in 1000 cells/μL) is significantly low, given a mean of 239.4 and standard deviation of 64.2, involves converting the value to a z score and comparing it to the significance threshold (z ≤ −2).

Percentiles
Percentiles are measures of location that divide a data set into 100 groups, each containing about 1% of the values. The kth percentile, Pk, is the value below which k percent of the data fall.
Notation: P1, P2, ..., P99
Finding the Percentile of a Data Value: Count the number of values less than x, divide by the total number of values, and multiply by 100. Round to the nearest whole number.
Converting a Percentile to a Data Value: Use the locator L = (k/100) × n, where k is the percentile and n is the number of data values. If L is a whole number, the percentile is the average of the Lth and (L+1)th values; otherwise, round up and use the corresponding value.
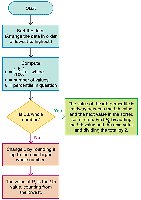
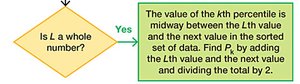
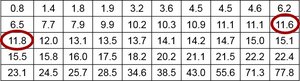
Example: For a data speed of 11.8 Mbps in a sorted list, the percentile is found by determining how many values are less than 11.8 and applying the formula. To find the 40th percentile (P40), calculate the locator and determine the value at that position.
Quartiles
Quartiles divide a data set into four equal parts, each containing about 25% of the values. They are denoted as Q1, Q2, and Q3.
Q1 (First Quartile): Same as P25; separates the lowest 25% from the highest 75%.
Q2 (Second Quartile): Same as P50 and the median; separates the lowest 50% from the highest 50%.
Q3 (Third Quartile): Same as P75; separates the lowest 75% from the highest 25%.
Note: There is not universal agreement on the exact procedure for calculating quartiles; different methods may yield slightly different results.
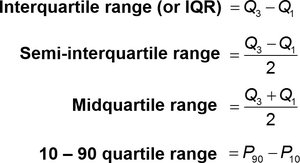
Formulas:
Interquartile Range (IQR):
Semi-interquartile Range:
Midquartile Range:
10–90 Quartile Range:
5-Number Summary
The 5-number summary provides a concise description of a data set using five key values:
Minimum
First quartile (Q1)
Median (Q2)
Third quartile (Q3)
Maximum
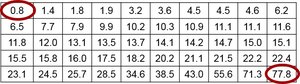
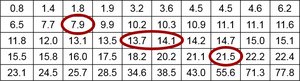
Example: For the Verizon airport data speeds, the 5-number summary is 0.8, 7.9, 13.9, 21.5, and 77.8 Mbps.
Boxplots (Box-and-Whisker Diagrams)
A boxplot is a graphical representation of the 5-number summary. It displays the distribution of data based on minimum, Q1, median, Q3, and maximum values.
Draw a line from the minimum to the maximum value.
Draw a box from Q1 to Q3 with a line at the median (Q2).
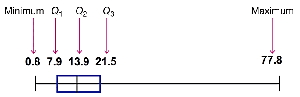
Interpretation: Boxplots help visualize the spread, center, and skewness of the data, as well as identify potential outliers.
Skewness
Skewness refers to the asymmetry in the distribution of data. A boxplot can help identify skewness: if the box or whiskers are longer on one side, the data is skewed in that direction.
Identifying Outliers and Modified Boxplots
Outliers are data values that are significantly higher or lower than the rest of the data. In a modified boxplot:
Calculate the interquartile range (IQR):
Any value greater than Q3 + 1.5 × IQR or less than Q1 − 1.5 × IQR is considered an outlier.
Outliers are marked with a special symbol (e.g., asterisk), and the whiskers extend only to the most extreme non-outlier values.
Summary Table: Main Measures of Relative Standing
Measure | Description |
|---|---|
z Score | Number of standard deviations a value is from the mean |
Percentile | Value below which a given percentage of data falls |
Quartile | Divides data into four equal parts |
5-Number Summary | Minimum, Q1, Median, Q3, Maximum |
Boxplot | Graphical display of the 5-number summary |
