 Indietro
Describing, Exploring, and Comparing Data: Measures of Center, Variation, and Relative Standing
Guida di studio - Note intelligenti
 Appunti personalizzati basati sui tuoi materiali, ampliati con definizioni chiave, esempi e contesto.
Describing, Exploring, and Comparing Data
Outliers
An outlier is a data value (or data point) that deviates significantly from the overall trend of the data. Outliers are often considered extreme values and can affect statistical measures such as the mean and standard deviation.

Measures of Center of a Data Set
Overview
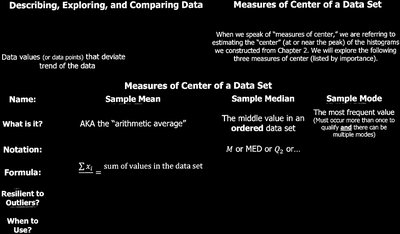
Measures of center help estimate the "center" (or central tendency) of a data set. The three primary measures are the sample mean, sample median, and sample mode.
Sample Mean
The sample mean (arithmetic average) is calculated by summing all values in the data set and dividing by the number of values.
Notation:
Formula:
Resilient to Outliers? No, the mean is sensitive to extreme values.
When to Use? When data is symmetric and has no extreme outliers.
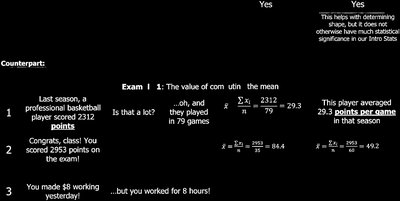
Example: If a basketball player scored 2312 points in 79 games, their average points per game is .
Sample Median
The sample median is the middle value in an ordered data set. It is more resilient to outliers than the mean.
Notation: or or
Resilient to Outliers? Yes
When to Use? When data is skewed or contains outliers.

Sample Mode
The sample mode is the most frequent value in the data set. There can be more than one mode if multiple values have the same highest frequency.
Resilient to Outliers? Yes
When to Use? Useful for categorical data or when identifying the most common value.
General Rounding Rule
Round the computed statistic to one more decimal place than is present in the original data.

Measures of Variation (Spread)
Overview
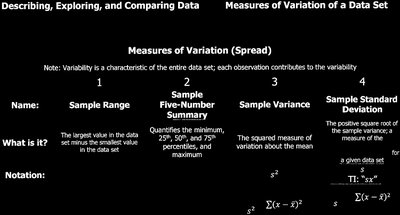
Measures of variation describe how spread out the data values are. Each observation contributes to the overall variability.
Sample Range
The range is the difference between the largest and smallest values in the data set.
Formula:
Caveat: Only tells the difference between the biggest and smallest values; not resilient to outliers.
Sample Five-Number Summary
The five-number summary quantifies the minimum, 25th percentile, median (50th percentile), 75th percentile, and maximum.
25th Percentile:
Median (50th Percentile):
75th Percentile:


Sample Variance
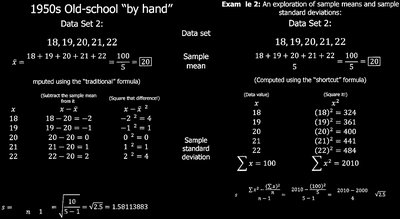
The sample variance measures the squared deviation of each value from the mean.
Notation:
Formula:
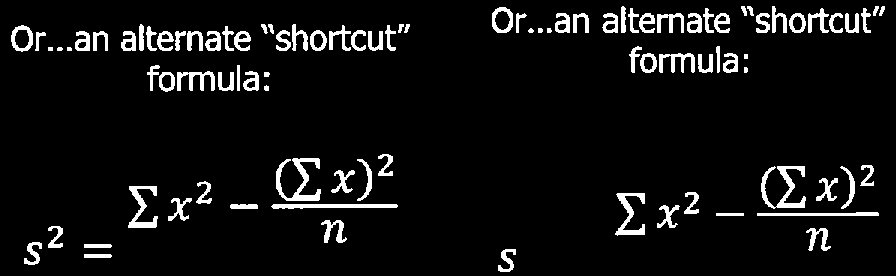
Shortcut Formula:
Sample Standard Deviation
The sample standard deviation is the positive square root of the variance and measures the average distance of each value from the mean.
Notation:
Formula:
Notes on Standard Deviation
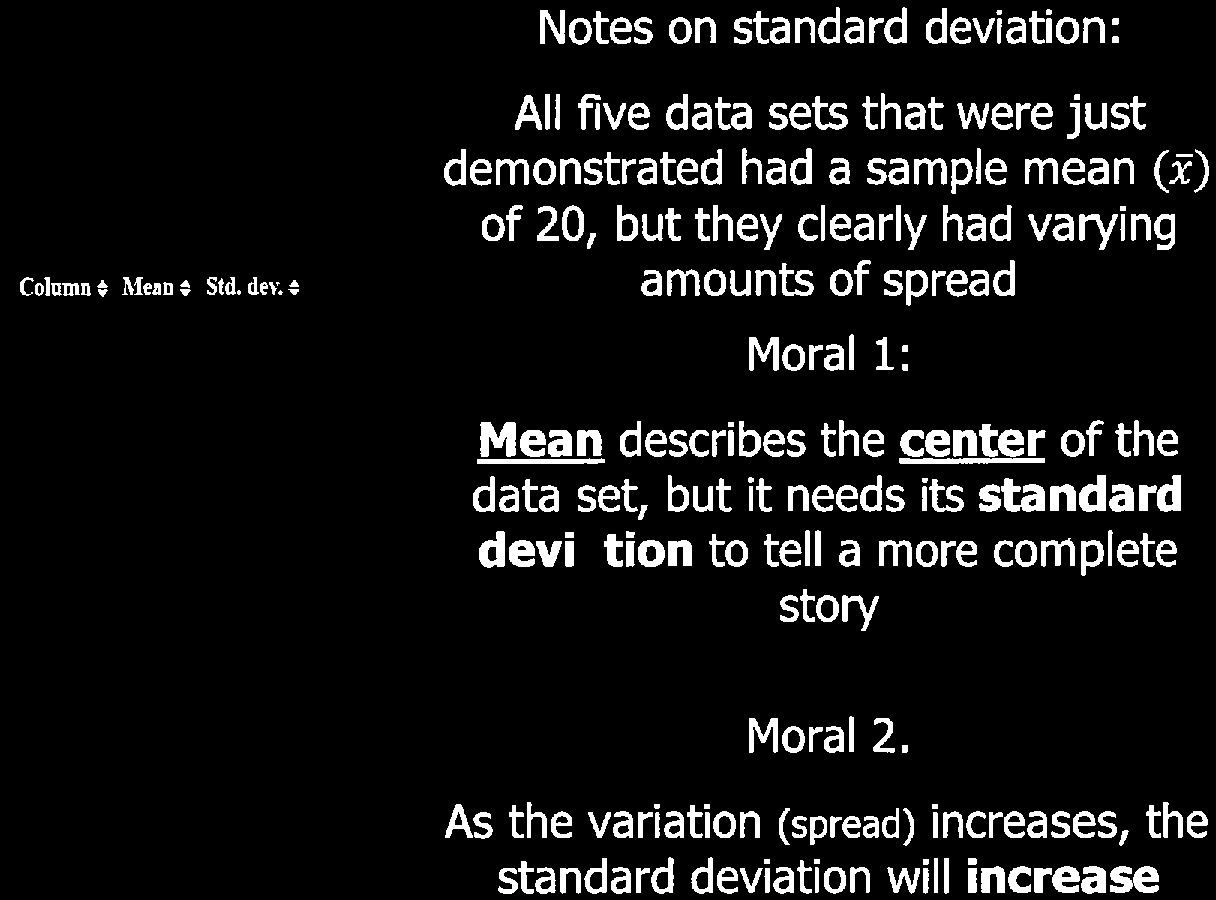
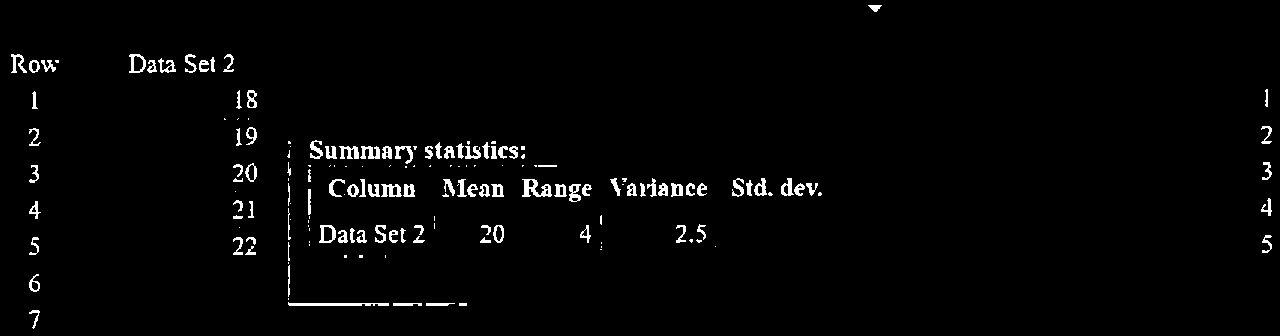
All five data sets demonstrated had a sample mean of 20, but varying amounts of spread. The mean describes the center, but standard deviation tells a more complete story. As variation increases, standard deviation increases.

Empirical Rule (68-95-99.7 Rule)
If the distribution is normal (bell-shaped), then:
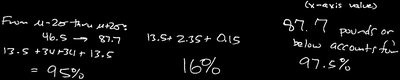
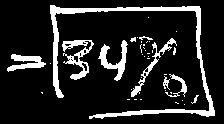
68% of data falls within 1 standard deviation of the mean
95% within 2 standard deviations
99.7% within 3 standard deviations


Chebyshev's Rule (Inequality)
For any data set (especially if the distribution is unknown), the proportion of data within standard deviations of the mean is at least for .
At least 75% of data falls within 2 standard deviations ()
Measures of Relative Standing and Boxplots
z-score (or z-value)
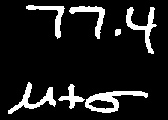
The z-score measures how many standard deviations a data value is from the mean. It is used to compare values from different distributions or to determine relative standing.
Formula:
If , the value equals the mean
If , the value is above the mean
If , the value is below the mean

z-scores and the Empirical Rule
z-scores can be related to the Empirical Rule:
68% of values have z-scores between -1 and 1
95% between -2 and 2
99.7% between -3 and 3
Practical Examples and Data Analysis
Data Set Calculations
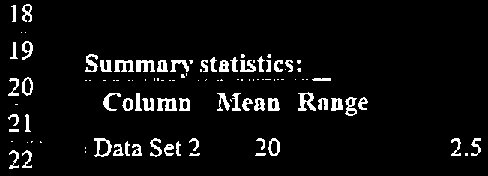
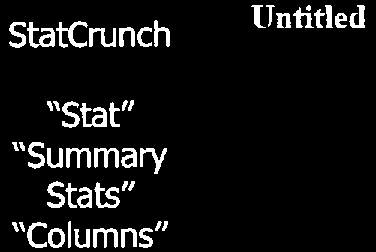
Sample calculations for mean, range, variance, and standard deviation are demonstrated using small data sets. These examples illustrate how different data sets can have the same mean but different spreads.
Effect of Outliers
Deleting an outlier is only done to demonstrate its effect on a data set. In practice, removing outliers can be misleading and is considered an abuse of statistics.
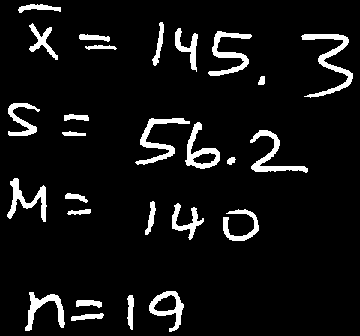
Boxplots and Five-Number Summary
Boxplots visually display the five-number summary and help identify outliers and the spread of the data.
Summary Table: Measures of Center and Variation
Measure | Definition | Formula | Resilient to Outliers? |
|---|---|---|---|
Mean | Arithmetic average | No | |
Median | Middle value in ordered data | --- | Yes |
Mode | Most frequent value | --- | Yes |
Range | Difference between max and min | No | |
Variance | Average squared deviation from mean | No | |
Standard Deviation | Square root of variance | No | |
z-score | Relative standing | --- |
Additional info: These notes expand on the original content by providing definitions, formulas, and context for each statistical measure, as well as practical examples and warnings about misuse of statistics.
