 Indietro
Describing, Exploring, and Comparing Data: Measures of Relative Standing and Boxplots
Guida di studio - Note intelligenti
 Appunti personalizzati basati sui tuoi materiali, ampliati con definizioni chiave, esempi e contesto.
Describing, Exploring, and Comparing Data
Measures of Relative Standing and Boxplots
This section introduces key statistical tools for understanding the position of individual data values within a data set. These include z scores, percentiles, quartiles, and graphical representations such as boxplots. These concepts help in comparing values from different data sets and identifying outliers or significant values.
z Scores
A z score (also called a standard score or standardized value) indicates how many standard deviations a data value (x) is above or below the mean. It allows for comparison across different data sets or distributions.
Formula for a sample:
Formula for a population:
Round-off rule: Round z scores to two decimal places (e.g., 2.31).
Interpretation:
z > 0: Value is above the mean.
z < 0: Value is below the mean.
z = 0: Value equals the mean.
Significance:
z ≤ −2: Significantly low value
z ≥ 2: Significantly high value
−2 < z < 2: Not significant
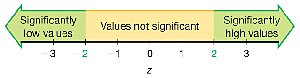
Example: If a body temperature of 99°F has a z score of 1.29 and a quarter weighing 5.7790 g has a z score of 2.26, the quarter's weight is more extreme relative to its data set because its z score is farther from the mean.
Application: To determine if an earthquake magnitude of 4.01 is significantly high, calculate its z score using the mean and standard deviation. If z ≥ 2, it is significantly high.
Percentiles
Percentiles divide a data set into 100 equal groups, each containing about 1% of the values. The kth percentile, Pk, is the value below which k% of the data fall.
Notation:
n: Total number of values
k: Percentile (e.g., for the 25th percentile, k = 25)
L: Locator (position in the sorted list)
Pk: kth percentile value
Finding the percentile of a data value: Count the number of values less than x, divide by n, and multiply by 100. Round to the nearest whole number.
Converting a percentile to a data value: Use the locator L = (k/100) × n. If L is not a whole number, round up to the next whole number; the value at this position is the percentile value.
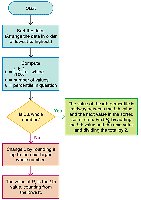
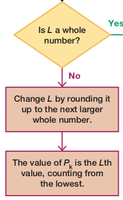
Example: In a sorted list of 50 wait times, the 25th percentile (P25) is the 13th value, which is 25 minutes. This means 25% of wait times are less than 25 minutes.
Quartiles
Quartiles divide a data set into four equal parts, each containing about 25% of the values:
Q1 (First quartile): Same as P25; separates the lowest 25% from the rest.
Q2 (Second quartile): Same as P50 and the median; separates the lowest 50% from the highest 50%.
Q3 (Third quartile): Same as P75; separates the lowest 75% from the highest 25%.
Note: There is not universal agreement on the exact procedure for calculating quartiles; different methods may yield slightly different results.
Statistics Defined Using Quartiles and Percentiles
Interquartile Range (IQR):
Semi-interquartile Range:
Midquartile:
10–90 Percentile Range:
5-Number Summary
The 5-number summary provides a concise description of a data set:
Minimum
First quartile (Q1)
Median (Q2)
Third quartile (Q3)
Maximum
Example: For "Space Mountain" wait times: 10, 25, 35, 50, and 110 minutes.
Boxplot (Box-and-Whisker Diagram)
A boxplot is a graphical representation of the 5-number summary. It displays the distribution, center, and spread of the data, and helps identify outliers and skewness.
Line from minimum to maximum value
Box from Q1 to Q3 with a line at the median (Q2)
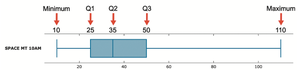
Skewness
Skewness refers to the asymmetry in the distribution of data. A boxplot can help identify whether a distribution is skewed (not symmetric) or symmetric.
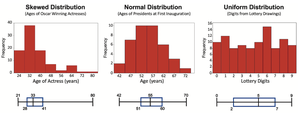
Skewed Distribution: Data extends more to one side.
Normal Distribution: Data is symmetric around the center.
Uniform Distribution: Data is evenly spread across the range.
Identifying Outliers for Modified Boxplots
Outliers are values that are unusually far from the rest of the data. In a modified boxplot:
Calculate IQR:
Compute 1.5 × IQR
A value is an outlier if it is: Above Q3 by more than 1.5 × IQR, or Below Q1 by more than 1.5 × IQR
Outliers are marked with a special symbol (e.g., asterisk or point), and the whiskers extend only to the most extreme non-outlier values.
Summary Table: Key Measures and Their Purposes
Measure | Purpose |
|---|---|
z Score | Standardizes values for comparison; identifies significant values |
Percentile | Describes relative standing within a data set |
Quartile | Divides data into four equal parts |
5-Number Summary | Summarizes distribution with five key values |
Boxplot | Visualizes distribution, spread, and outliers |
IQR | Measures spread of the middle 50% of data |
