Indietro
Descriptive Statistics: Measures of Center and Spread (Chapter 3 Study Notes)
Guida di studio - Note intelligenti
 Appunti personalizzati basati sui tuoi materiali, ampliati con definizioni chiave, esempi e contesto.
Descriptive Statistics
Overview
Descriptive statistics are numerical methods used to summarize and describe the main features of a data set. These statistics help characterize the data's center and spread, providing insight into its distribution and variability.
Numbers that describe data
Characterize the data’s center and spread
Notation
Statistical Symbols
Statistical notation is essential for understanding formulas and calculations in statistics. Common symbols include:
Σ - denotes the sum of a set of values.
x - represents individual values.
n - number of values in a sample (sample size).
N - number of values in a population (population size).
Population and Sample Size
Identifying Population and Sample
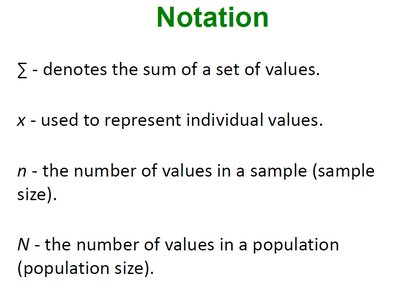
In statistics, it is important to distinguish between the population (entire group) and the sample (subset of the population). For example:
Population size: All 50 states in a study.
Sample size: 10 states selected from the population.
Measures of Center
Definition and Types
Measures of center describe the middle or central value of a data set. Common measures include the mean, median, mode, and midrange.
Mean - arithmetic average
Median - middle value
Mode - most frequent value
Midrange - average of maximum and minimum values
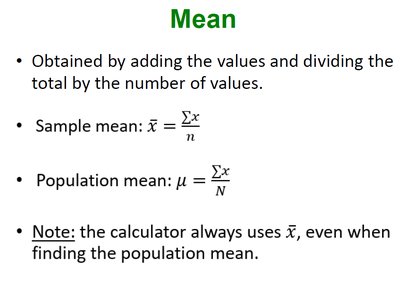
Mean
The mean is calculated by adding all values and dividing by the number of values. It is the most common measure of center.
Sample mean:
Population mean:
Note: Calculators typically use for both sample and population mean.
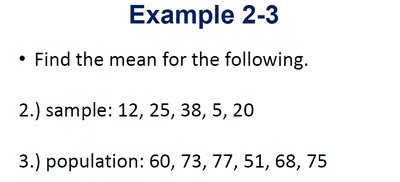
Example: Calculating Mean
Sample: 12, 25, 38, 5, 20
Population: 60, 73, 77, 51, 68, 75
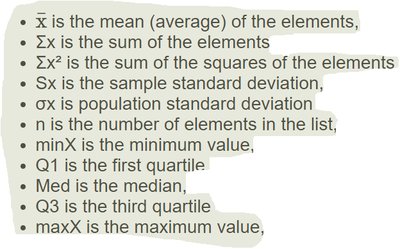
Calculator Notation
Statistical calculators use specific symbols for common statistics:
: mean (average)
: sum of elements
: sum of squares
: sample standard deviation
: population standard deviation
minX: minimum value
Q1: first quartile
Med: median
Q3: third quartile
maxX: maximum value
Mean of Grouped Data
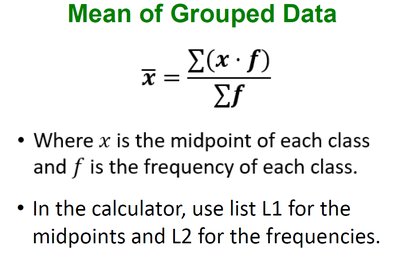
For grouped data, the mean is calculated using class midpoints and frequencies:
x: midpoint of each class
f: frequency of each class
Example: Frequency Distribution
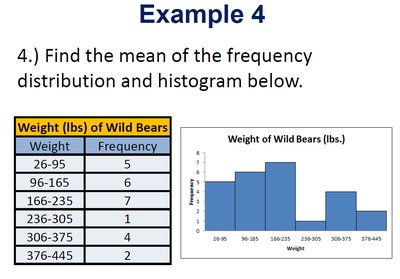
Find the mean of the frequency distribution and histogram:
Weight (lbs) | Frequency |
|---|---|
26-95 | 5 |
96-165 | 6 |
166-235 | 7 |
236-305 | 5 |
306-375 | 4 |
376-445 | 2 |
Weighted Mean
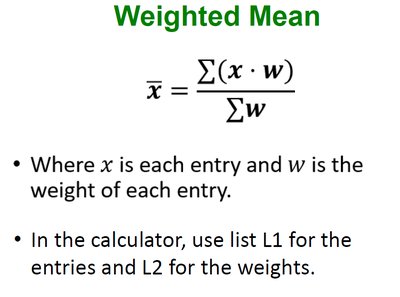
The weighted mean accounts for varying importance (weights) of each entry:
x: each entry
w: weight of each entry
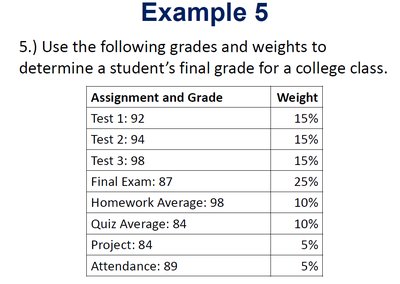
Example: Weighted Mean Calculation
Assignment and Grade | Weight |
|---|---|
Test 1: 92 | 15% |
Test 2: 94 | 15% |
Test 3: 98 | 15% |
Final Exam: 87 | 25% |
Homework Average: 98 | 10% |
Quiz Average: 84 | 10% |
Project: 84 | 5% |
Attendance: 89 | 5% |
Resistance
The mean is sensitive to extreme values (outliers) and is not a resistant measure of center. This means that a single unusually high or low value can significantly affect the mean.
Median
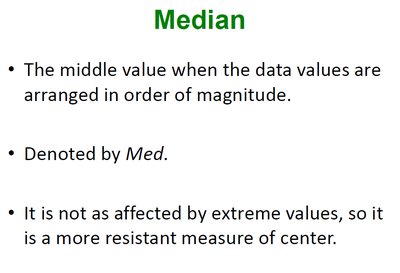
The median is the middle value when data are arranged in order. It is denoted by Med and is a more resistant measure of center, as it is less affected by extreme values.
Example: Calculating Median
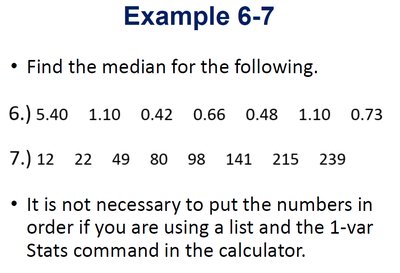
6.) 5.40, 1.10, 0.42, 0.66, 0.48, 1.10, 0.73
7.) 12, 22, 49, 80, 98, 141, 215, 239
Shape of the Distribution
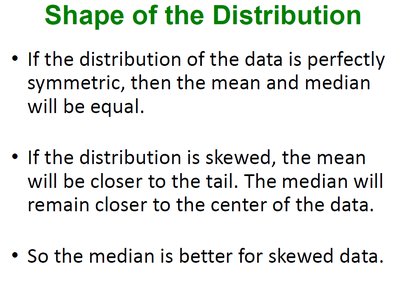
The relationship between mean and median depends on the shape of the distribution:
If perfectly symmetric, mean and median are equal.
If skewed, mean is closer to the tail; median remains closer to the center.
Median is preferred for skewed data.
Example: Mean vs. Median Resistance
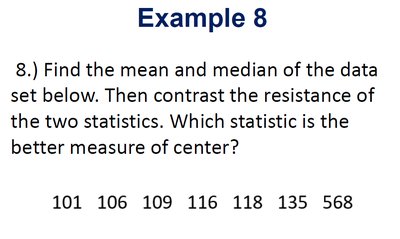
Find the mean and median for the data set: 101, 106, 109, 116, 118, 135, 568. Contrast their resistance to outliers.
Mode and Modal Class
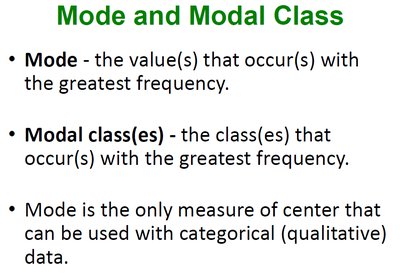
The mode is the value(s) that occur with the greatest frequency. Modal class refers to the class(es) with the highest frequency in grouped data. Mode is the only measure of center usable with categorical (qualitative) data.
Example: Finding Mode
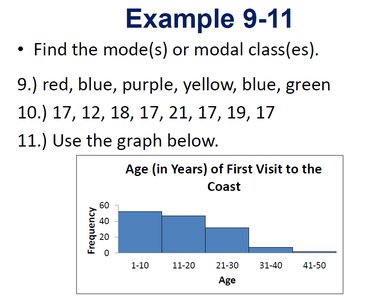
9.) red, blue, purple, yellow, blue, green
10.) 17, 12, 18, 17, 21, 17, 19, 17
11.) Use the graph below (age of first visit to the coast)
Numbers of Modes
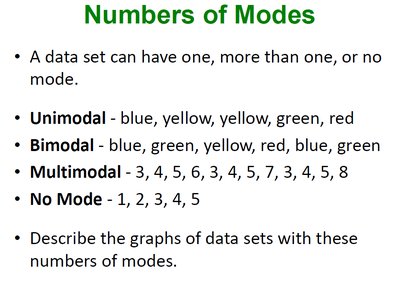
A data set can have one, more than one, or no mode:
Unimodal: one mode
Bimodal: two modes
Multimodal: more than two modes
No Mode: all values occur with equal frequency
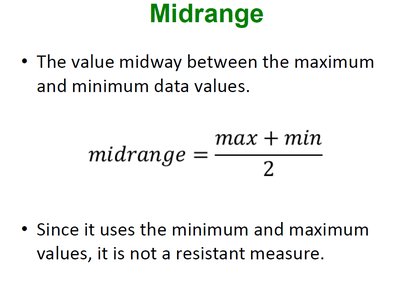
Midrange
The midrange is the value midway between the maximum and minimum data values:
Since it uses extreme values, it is not a resistant measure.
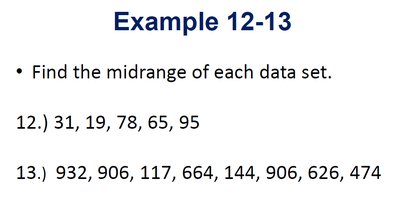
Example: Calculating Midrange
12.) 31, 19, 78, 65, 95
13.) 932, 906, 117, 664, 144, 906, 626, 474
Measures of Spread
Definition and Types
Measures of spread describe the variation or dispersion of a data set. Common measures include range, standard deviation, and variance.
Range - difference between maximum and minimum values
Standard Deviation - average distance from the mean
Variance - average squared distance from the mean