 Indietro
Discrete Random Variables, Binomial, and Poisson Distributions: Study Guide
Guida di studio - Note intelligenti
 Appunti personalizzati basati sui tuoi materiali, ampliati con definizioni chiave, esempi e contesto.
Discrete Random Variables
Definition and Types
A random variable is a numerical measure of the outcome of a probability experiment. Random variables are typically denoted by capital letters such as X.
Discrete random variable: Takes on a finite or countable number of values. Example: The number of heads in three coin flips.
Continuous random variable: Takes on infinitely many values within a range, without gaps. Example: The time between the arrival of cars at a drive-through window.
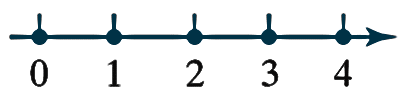
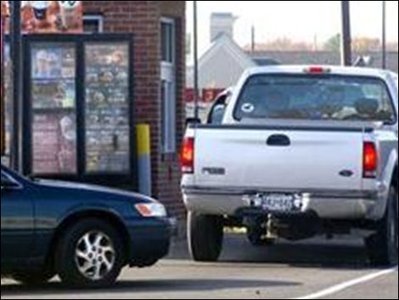
Identifying Discrete vs. Continuous Random Variables
To determine whether a random variable is discrete or continuous, consider whether the variable can be counted (discrete) or measured (continuous).
Discrete: Number of light bulbs that burn out in a room of 10 light bulbs; sum of a roll of a pair of fair dice.
Continuous: Weight of a T-bone steak; amount of snow in Denver during March.
Probability Distribution of a Discrete Random Variable
A probability distribution for a discrete random variable X lists all possible values of the variable and their corresponding probabilities. It can be represented as a table, graph, or mathematical formula.
Rules:
for all x
Example Probability Distribution Table
x | P(x) |
|---|---|
1 | 0.2 |
2 | 0.25 |
3 | 0.1 |
4 | 0.14 |
5 | 0.31 |
Total | 1.0 |
Additional info: The last probability is inferred to ensure the sum is 1.
Mean (Expected Value) and Standard Deviation of Discrete Random Variables
Mean (Expected Value)
The mean (or expected value) of a discrete random variable is the average value expected per repetition of the experiment.
Formula:
The mean does not need to be one of the possible values of the random variable.
Example: DVDs Rented Probability Distribution
x | P(x) |
|---|---|
0 | 0.06 |
1 | 0.58 |
2 | 0.22 |
3 | 0.10 |
4 | 0.03 |
5 | 0.01 |
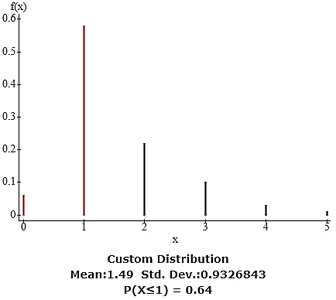
Standard Deviation and Variance
The standard deviation measures the spread of the probability distribution.
Standard deviation formula:
Variance formula:
Probability Distribution Graphs
Credit Card Example
Probability distributions can be visualized using graphs. The shape of the distribution provides insight into the data's spread and central tendency.
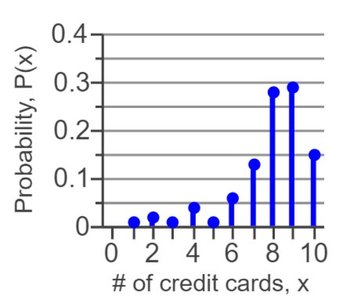
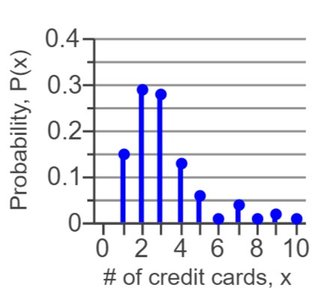
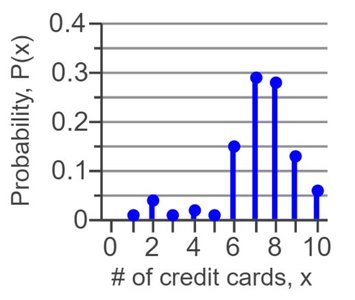
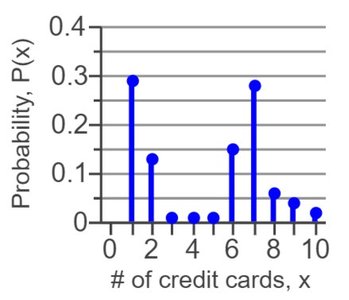
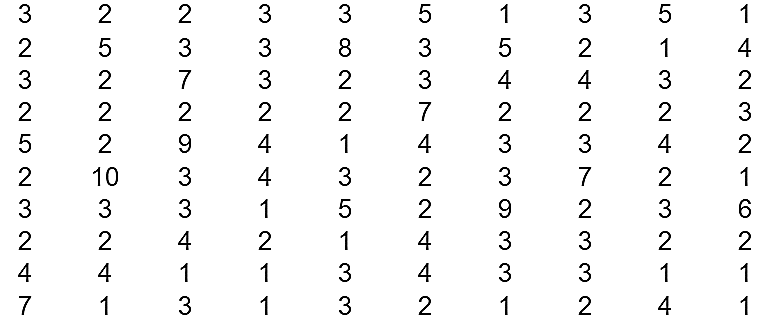
Interpretation of the Mean (Expected Value)
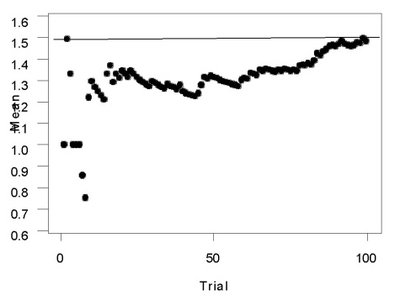
Law of Large Numbers
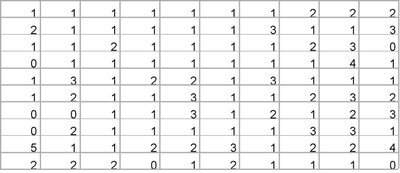
As the number of trials increases, the sample mean approaches the mean of the probability distribution, demonstrating the Law of Large Numbers.
Expected Value in Real-Life Contexts
The expected value, denoted E(X), represents what we would expect to happen in the long run.
Formula:
Example: Life Insurance Policy
Suppose a life insurance company sells a $250,000 one-year term life insurance policy to a 49-year-old female for $530. The probability the female will survive the year is 0.99791. Let X be the value to the insurance company. The expected value is calculated using the possible outcomes and their probabilities.
Example: Fair Game with Dice
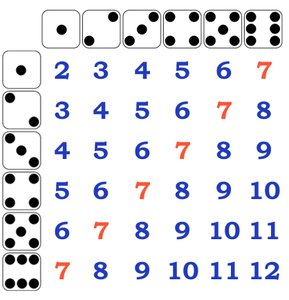
If a player rolls two dice and gets a sum of 2 or 12, the player wins $20. If the player rolls a sum of 7, they win $5. The cost to play the game is $3. The expected value is calculated to determine if the game is fair.
Binomial Probability Distribution
Definition and Conditions
A binomial experiment is defined by:
Fixed number of trials (n)
Trials are independent
Each trial has two mutually exclusive outcomes: success or failure
Probability of success (p) is the same for each trial
Binomial Probability Distribution Function
The probability of obtaining x successes in n independent trials:
Formula:
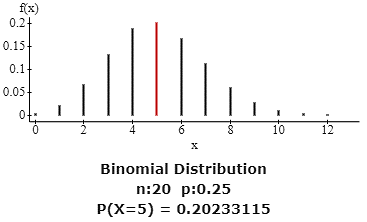
Example: Wireless-Only Households
In a random sample of 20 households, what is the probability that 5 are wireless-only?
Interpreting Probability Statements
Phrase | Math Symbol |
|---|---|
Equals / Exactly / Is/Are | = |
At least / No less than / Greater than or equal to | ≥ |
More than / Greater than | > |
Fewer than / Less than | < |
No more than / At most / Less than or equal to | ≤ |
Example: Hiding Purchases
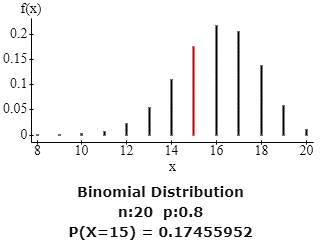
In a random sample of 20 married people, what is the probability that exactly 15 hide purchases from their mate?
Example: True/False Quiz
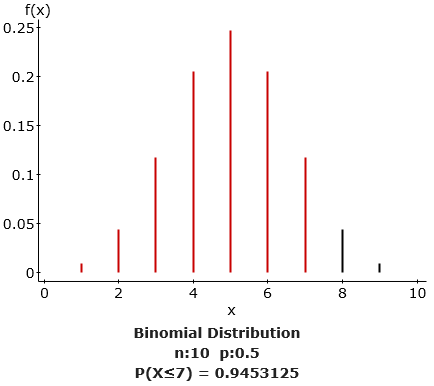
A quiz consists of 10 true or false questions. To pass, a student must answer at least eight correctly. If the student guesses, what is the probability they pass?
Mean and Standard Deviation of Binomial Random Variable
Mean:
Standard deviation:
Example: Car-Owning Households
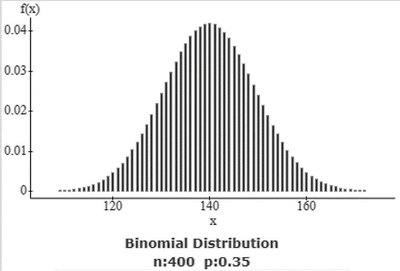
In a sample of 400 car-owning households, determine the mean and standard deviation for households with three or more cars.
Binomial Probability Histograms
The shape of a binomial distribution depends on both n and p. For a fixed p, as n increases, the distribution becomes bell-shaped. If , the binomial distribution is approximately normal.
Poisson Probability Distribution
Definition and Conditions
The Poisson probability distribution is used to compute probabilities for the number of occurrences (successes) of a particular event within a specified interval (usually time or space).
The probability of two or more successes in any sufficiently small subinterval is 0.
The probability of success is the same for any two intervals of equal length.
The number of successes in any interval is independent of the number in any other non-overlapping interval.
Poisson Probability Distribution Function
Formula: , where is the average number of occurrences per interval of length 1, and .
Example: Website Hits
The hits to a website occur at the rate of 10 per minute. What is the probability of a certain number of hits in a given interval?
Mean and Standard Deviation of Poisson Random Variable
Mean:
Standard deviation:
Example: Chocolate Bar Insect Fragments
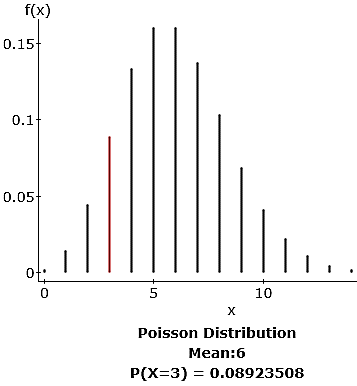
Suppose a chocolate bar has 0.6 insect fragments per gram. Calculate the mean number of fragments in a 10-gram sample and compute probabilities for different counts.
Example: Beetle Distribution
A biologist performs an experiment with 2000 Asian beetles in an enclosed area divided into 200 subsections. Calculate the expected number of beetles per subsection, mean, standard deviation, and probabilities for finding a certain number of beetles.
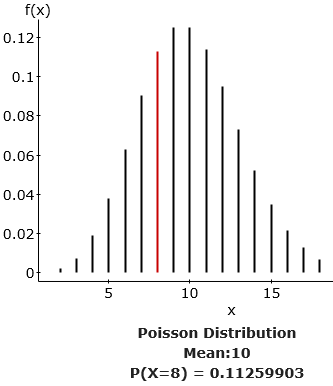
Example: Rescue Calls and Births
Calculate Poisson probabilities for rescue calls received per hour and babies born during a shift, using the mean rate provided.
Summary Table: Binomial vs. Poisson Distributions
Distribution | Typical Use | Key Parameters |
|---|---|---|
Binomial | Fixed number of trials, two outcomes | n (trials), p (success probability) |
Poisson | Number of events in a fixed interval | λ (mean rate), t (interval length) |
Additional info: This table is inferred for comparison purposes.
