 Indietro
Inferring Population Means and Comparing Groups: Confidence Intervals, Hypothesis Tests, and Variance Analysis
Guida di studio - Note intelligenti
 Appunti personalizzati basati sui tuoi materiali, ampliati con definizioni chiave, esempi e contesto.
Confidence Intervals for Population Means
Introduction to Confidence Intervals
Confidence intervals are used to estimate population parameters by providing a range of plausible values, rather than a single point estimate. The confidence level represents the probability that the interval contains the true parameter.
Point Estimate: The best single estimate of a parameter (e.g., sample mean).
Confidence Interval: A range of values likely to contain the parameter, often written as .
Confidence Level: The probability (e.g., 95%) that the interval contains the parameter. Notation: .
Margin of Error: The distance between the point estimate and the bounds of the interval.
Example:
For a 95% confidence interval with point estimate and margin of error , the interval is .
Critical Values and Calculating Margin of Error
Critical values (z-scores or t-scores) are used to calculate the margin of error. The total area in the tails of a confidence interval is .
Critical Value: or , depending on whether the population standard deviation is known.
Margin of Error Formula (z):
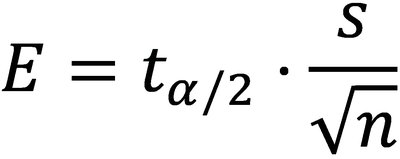
Margin of Error Formula (t):
Table: Common Critical Values
Confidence Level | z-value |
|---|---|
90% | 1.645 |
95% | 1.960 |
99% | 2.576 |
Population Standard Deviation Known vs. Unknown
When the population standard deviation () is known, use the z-distribution. When unknown, use the t-distribution with sample standard deviation () and degrees of freedom ().
z-distribution: Used when is known and sample size or population is normal.
t-distribution: Used when is unknown, sample size or population is normal.
Example:
Construct a 99% confidence interval for a mean travel time with sample mean hour, minutes, .
Using TI-84 Calculator for Confidence Intervals
TI-84 calculators can compute confidence intervals using ZInterval or TInterval functions. Enter sample statistics or raw data, specify confidence level, and select the appropriate function.
ZInterval: Use when is known.
TInterval: Use when is unknown.

Minimum Sample Size for Confidence Intervals
Determining Sample Size
To achieve a desired margin of error, rearrange the margin of error formula to solve for sample size .
Sample Size Formula:
Range Rule of Thumb: Estimate as if not given.

Comparing Two Proportions
Hypothesis Tests for Two Proportions
To test claims about the difference between two proportions, use a pooled sample proportion and calculate the z-score.
Null Hypothesis:
Test Statistic:
Pooled Proportion:
Confidence Intervals for Two Proportions
Construct a confidence interval for the difference in proportions using individual sample proportions.
Margin of Error:
Interval:
Comparing Two Means
Hypothesis Tests for Two Means (Unknown, Unequal Variances)
When comparing means from two independent samples with unknown and unequal variances, use the t-distribution.
Null Hypothesis:
Test Statistic:
Degrees of Freedom:
Confidence Intervals for Two Means
Construct a confidence interval for the difference in means using the t-distribution.
Margin of Error:
Interval:
Matched Pairs (Dependent Samples)
Introduction to Matched Pairs
Matched pairs occur when two data sets are related, and each value in one set is paired with a value in the other set. Common relationships include before-and-after measurements or related individuals.
Difference Calculation: for each pair.
Mean Difference:
Standard Deviation of Differences:
Hypothesis Tests and Confidence Intervals for Matched Pairs
Replace the sample mean with the mean difference and use the t-distribution for hypothesis tests and confidence intervals.
Test Statistic:
Confidence Interval: where
Hypothesis Test for Correlation Coefficient
Testing the Significance of Correlation
The correlation coefficient () measures the strength and direction of a linear relationship. Hypothesis tests can determine if the correlation is statistically significant.
Null Hypothesis: (no correlation)
Alternative Hypothesis: (correlation exists)
Test Statistic: Use LinRegTTest on TI-84.

F-Distribution and Two Variances
Introduction to F-Distribution
The F-distribution is used to compare two variances. It is always right-skewed and takes only positive values. The F-statistic is calculated as the ratio of two sample variances.
Null Hypothesis:
Test Statistic:
Degrees of Freedom: ,
Hypothesis Tests for Two Variances Using TI-84
Use the 2-SampFTest function on TI-84 to perform hypothesis tests for two variances.

Summary Table: Key Formulas
Concept | Formula |
|---|---|
Margin of Error (z) | |
Margin of Error (t) | |
Sample Size | |
Range Rule of Thumb | |
Degrees of Freedom |

Additional info: These notes expand on the original content by providing definitions, formulas, and examples for each major topic, ensuring completeness and academic quality for exam preparation.
