 Indietro
Introduction to Statistics: Key Concepts and Foundations
Guida di studio - Note intelligenti
 Appunti personalizzati basati sui tuoi materiali, ampliati con definizioni chiave, esempi e contesto.
Introduction to Statistics
What is Statistics?
Statistics is the science of collecting, organizing, analyzing, and interpreting data to make informed decisions. It provides tools for understanding data and drawing conclusions about populations based on samples.
Data: Information gathered from counting, measuring, or collecting responses.
Population: The entire set of individuals or items of interest ("every," "all").
Sample: A subset of the population, selected for analysis.
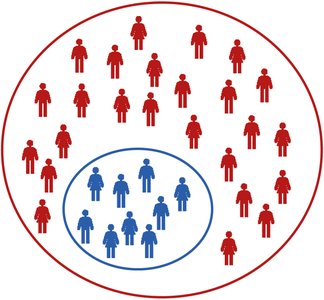
Parameters vs. Statistics
Understanding the difference between parameters and statistics is fundamental in statistics:
Parameter: A numerical value that describes a characteristic of a population (e.g., the average salary of all employees).
Statistic: A numerical value that describes a characteristic of a sample (e.g., the average salary of a sample of employees).
Example: If you measure the average height of every student in a school, that average is a parameter. If you measure the average height of 20 randomly selected students, that average is a statistic.
Types of Data
Qualitative vs. Quantitative Data
Data can be classified as either qualitative or quantitative:
Qualitative Data: Describes qualities or categories (e.g., favorite color, eye color).
Quantitative Data: Consists of numerical values representing counts or measurements.


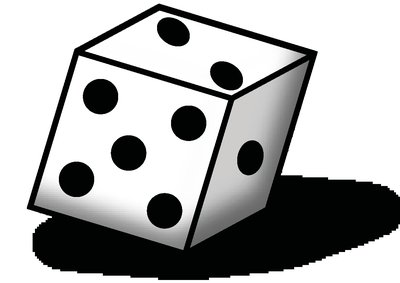
Discrete Quantitative Data: Countable values (e.g., number of students, dice rolls).
Continuous Quantitative Data: Measurable values that can take any value within a range (e.g., time, temperature).


Levels of Measurement
Understanding Levels of Measurement
Levels of measurement describe how data can be categorized and what mathematical operations are meaningful:
Level | Description | Qualitative/Quantitative | Example |
|---|---|---|---|
Nominal | Categories, names, or labels; no order or calculations | Either | Hair color |
Ordinal | Ordered categories; differences not meaningful | Either | Letter grades |
Interval | Ordered, meaningful differences; no true zero | Quantitative | Temperature (°C or °F) |
Ratio | Ordered, meaningful differences; true zero exists | Quantitative | Height, weight |
Example: Birth years (interval), satisfaction ratings (ordinal), working hours (ratio), favorite music genre (nominal).
Collecting Data
Observational Studies vs. Experiments
There are two main ways to collect data:
Observational Study: Researchers observe and measure characteristics without influencing the subjects. Causation cannot be assumed.
Experiment: Researchers apply a treatment and observe its effects. Causation can be inferred if the experiment is well-designed.


Sampling Methods
Simple Random Sampling (SRS)
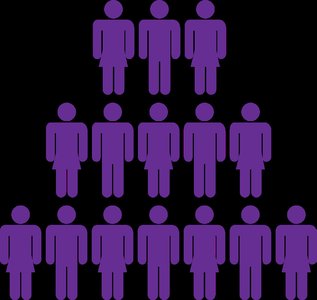
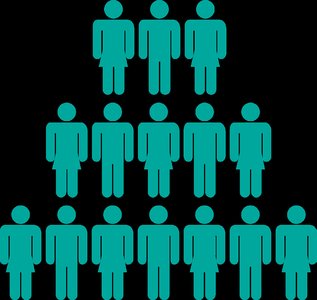
Sampling is the process of selecting a subset (sample) from a population. In SRS, every individual and every possible group of individuals has an equal chance of being selected.
Representative Sample: A sample that accurately reflects the characteristics of the population.

Other Sampling Methods
Systematic Sampling: Select every k-th subject from a list or sequence.
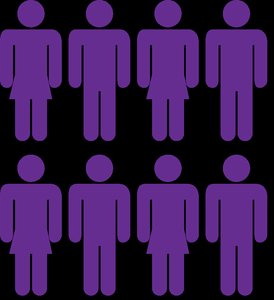
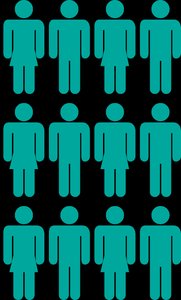
Cluster Sampling: Divide the population into groups (clusters), randomly select clusters, and include all members from selected clusters.
Stratified Sampling: Divide the population into strata (groups with similar characteristics), then randomly sample from each stratum.
Example: Testing every 12th cookie (systematic), randomly selecting classes (cluster), or selecting random students from each grade (stratified).
