 Indietro
Introduction to Statistics: Understanding Data, Populations, and Statistical Methods
Guida di studio - Note intelligenti
 Appunti personalizzati basati sui tuoi materiali, ampliati con definizioni chiave, esempi e contesto.
Statistics Overview
What is Statistics?
Statistics is the art and science of learning from data. It involves designing studies, analyzing data, and translating data into knowledge and understanding. The field of statistics helps us make sense of the world by providing tools to collect, summarize, and interpret information.
Definition: Statistics is the discipline that concerns the collection, organization, analysis, interpretation, and presentation of data.
Purpose: To draw meaningful conclusions from data and make informed decisions.
Investigating Using Data
What is Data?
Data refers to information gathered through experiments and surveys. It can be numerical (quantitative) or descriptive (qualitative).
Examples:
Survey: Percentage of people who went to Starbucks after seeing a TV ad.
Experiment: Measurements on subjects before and after a low carbohydrate diet.


Probability vs. Statistics
Probability and statistics are related but distinct fields:
Probability: Starts with known population information to predict sample outcomes.
Statistics: Starts with sample data to make inferences about the population.
Example: If you know the political affiliations of a population, you can use probability to predict the makeup of a random sample. If you only have sample data, you use statistics to infer the population's characteristics.
Three Aspects of a Statistical Study
1. Design
Design refers to planning how to obtain data. Proper design ensures trustworthy results and involves decisions such as how to conduct experiments or select survey participants.
Example: Planning a study to examine the effects of Vitamin E on athletic strength.
2. Description
Description involves summarizing the collected data using graphs and numerical summaries (e.g., averages, percentages).
Descriptive Statistics: Methods for summarizing data, often using charts, graphs, and summary statistics.
Examples:
A meteorologist constructs a line graph showing monthly precipitation.
The average age of students in a statistics class is 25 years.
3. Inference
Inference refers to making decisions or predictions about a population based on sample data. Inferential statistics allow us to generalize findings from a sample to a larger population.
Examples:
Predicting the proportion of drivers who will violate a law based on a sample survey.
Determining if there is a relationship between smoking and emphysema.
Populations, Samples, and Subjects
Subjects
Subjects are the entities measured in a study. They can be individuals, groups, animals, or objects.
Examples: Individuals, schools, rats, municipalities, manufactured items.


Population and Sample
The population is the entire group of subjects of interest, while a sample is a subset of the population from which data are actually collected.
Population: All subjects of interest in a study.
Sample: A subset of the population for whom we have data.


Example: General Social Survey
In a Canadian survey, 29,516 people were asked if the local police treat people fairly, and 61.9% agreed. Here, the sample is the 29,516 respondents, and the population is all Canadians.
Descriptive vs. Inferential Statistics
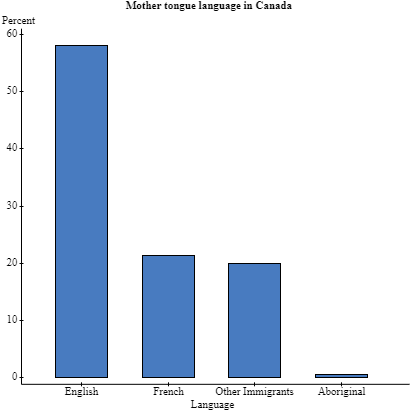
Descriptive statistics summarize data using graphs and numbers, while inferential statistics use sample data to make predictions or decisions about a population.
Descriptive Statistics: Summarize raw data (e.g., averages, percentages, charts).
Inferential Statistics: Make predictions or decisions about a population based on sample data.

Sample Statistics and Population Parameters
Parameters
A parameter is a numerical summary of a population (e.g., population mean, population proportion).
Examples:
Mean (\( \mu \)) number of cigarettes smoked by all teenagers.
Proportion (\( p \)) of all teenagers who smoked in the last month.
Statistics
A statistic is a numerical summary of a sample taken from the population (e.g., sample mean, sample proportion).
Examples:
Mean number of cigarettes smoked per day by a sample of teenagers.
Proportion of a sample of teenagers who smoked in the last month.
Randomness and Variability
Randomness
Randomness is essential in statistics to ensure that the sample is representative of the population. Simple Random Sampling (SRS) gives each subject in the population an equal chance of being selected.
Purpose: To make valid inferences about the population.
Variability
Variability refers to the natural differences in measurements from subject to subject and from sample to sample. Larger samples tend to yield more accurate predictions due to reduced variability.
Key Point: Individual and sample measurements vary, which is why statistical inference always involves some uncertainty.
Lesson Summary
Statistics is the art and science of learning from data.
Proper study design is crucial for obtaining reliable data.
Descriptive statistics summarize sample data; inferential statistics use sample data to make predictions about populations.
Random sampling ensures representativeness; variability is inherent in all data.
