 Indietro
Introductory Statistics: Data Collection and Experimental Design
Guida di studio - Note intelligenti
 Appunti personalizzati basati sui tuoi materiali, ampliati con definizioni chiave, esempi e contesto.
Data Collection in Statistics
Introduction to the Practice of Statistics
Statistics is the science of collecting, organizing, summarizing, and analyzing information to draw conclusions or answer questions. It also provides a measure of confidence in any conclusions. The information used in statistics is called data, which describes characteristics of individuals and exhibits variability.
Statistics: The study of data and variability.
Statistical Thinking: Understanding and interpreting variability in data.
Data: Facts or propositions used to draw conclusions or make decisions.
Variability: The tendency of data to differ among individuals or over time.
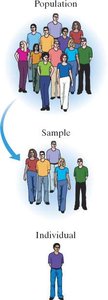
The Process of Statistics
The process of statistics involves four main steps:
Identify the research objective: Define the question and population to be studied.
Collect the data: Gather information, often from a sample rather than the entire population.
Describe the data: Use descriptive statistics to summarize and organize data.
Perform inference: Apply inferential statistics to extend sample results to the population and report reliability.
Population: The entire group of individuals to be studied. Sample: A subset of the population. Parameter: Numerical summary of a population. Statistic: Numerical summary based on a sample.
Types of Variables and Data
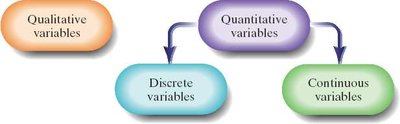
Qualitative vs. Quantitative Variables
Variables are characteristics of individuals within a population. They can be classified as:
Qualitative (Categorical) Variables: Classify individuals based on attributes or characteristics.
Quantitative Variables: Provide numerical measures that can be meaningfully added or subtracted.
Example: Nationality (qualitative), Number of children (quantitative), Household income (quantitative), Level of education (qualitative), Daily intake of whole grains (quantitative).
Discrete vs. Continuous Variables
Quantitative variables are further classified as:
Discrete Variables: Have a finite or countable number of possible values (e.g., number of children).
Continuous Variables: Have an infinite number of possible values and can be measured to any desired accuracy (e.g., household income).
Data: The list of observations a variable assumes. Qualitative Data: Observations from qualitative variables. Quantitative Data: Observations from quantitative variables.
Levels of Measurement
Variables can be measured at different levels:
Nominal: Values name, label, or categorize; no order (e.g., gender).
Ordinal: Values can be ranked or ordered (e.g., class rank).
Interval: Differences between values have meaning; zero does not mean absence (e.g., temperature).
Ratio: Ratios of values have meaning; zero means absence (e.g., number of vending machines).
Observational Studies and Experiments
Observational Study vs. Designed Experiment
An observational study measures the value of the response variable without influencing it. A designed experiment involves assigning individuals to groups, manipulating the explanatory variable, and recording the response variable.
Response Variable: The outcome of interest.
Explanatory Variable: The variable that is manipulated or observed to affect the response.
Confounding: When the effects of two or more explanatory variables cannot be separated.
Lurking Variable: An unaccounted variable that affects the response.
Observational studies can only claim association, not causation.
Types of Observational Studies
Cross-sectional Studies: Collect information at a specific point in time.
Case-control Studies: Retrospective; compare individuals with and without certain characteristics.
Cohort Studies: Prospective; follow a group over time and record characteristics.
Census: A list of all individuals in a population with their characteristics.
Sampling Methods
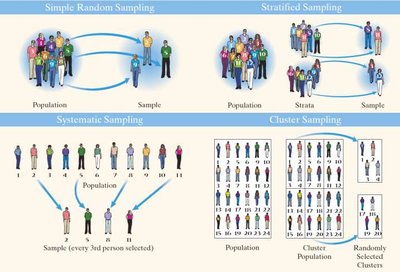
Simple Random Sampling
Random sampling uses chance to select individuals from a population. A simple random sample ensures every possible sample of size n has an equally likely chance of occurring.
Obtain a frame listing all individuals.
Number individuals from 1 to N.
Use a random number generator to select n individuals.
Other Effective Sampling Methods
Stratified Sampling: Divide population into homogeneous groups (strata), then sample from each stratum.
Systematic Sampling: Select every kth individual from the population, starting at a random point.
Cluster Sampling: Select all individuals within randomly chosen groups (clusters).
Convenience Sampling: Use easily obtained individuals; results are often biased.
Multistage Sampling: Combine multiple sampling techniques.
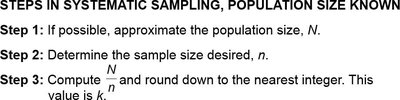
Systematic Sampling Steps
Step 1: Approximate population size, N.
Step 2: Determine sample size, n.
Step 3: Compute and round down to the nearest integer (value is k).
Step 4: Randomly select a number between 1 and k (call this p).
Step 5: Sample consists of p, p + k, p + 2k, ..., p + (n − 1)k.
Bias in Sampling
Sources of Bias
If a sample is not representative of the population, it is biased. Main sources of bias include:
Sampling Bias: Technique favors one part of the population.
Nonresponse Bias: Individuals who do not respond differ from those who do.
Response Bias: Survey answers do not reflect true feelings (interviewer error, misrepresented answers, wording, order).
Data-entry Error: Mistakes in recording data.

Nonsampling Errors: Errors from bias or data-entry, present even in a census. Sampling Error: Error from using a sample to estimate population information.
Experimental Design
Characteristics of an Experiment
An experiment is a controlled study to determine the effect of varying explanatory variables (factors) on a response variable. Treatments are combinations of factor values. Experimental units are the subjects receiving treatments. Control groups and placebos are used for comparison. Blinding prevents knowledge of treatment assignment.
Single-blind: Subjects do not know their treatment.
Double-blind: Neither subjects nor researchers know the treatment.
Steps in Designing an Experiment
Identify the problem and response variable.
Determine factors affecting the response variable.
Determine the number of experimental units.
Determine the level of predictor variables (control, randomize).
Conduct the experiment (replication, data collection).
Test the claim using inferential statistics.
Completely Randomized Design
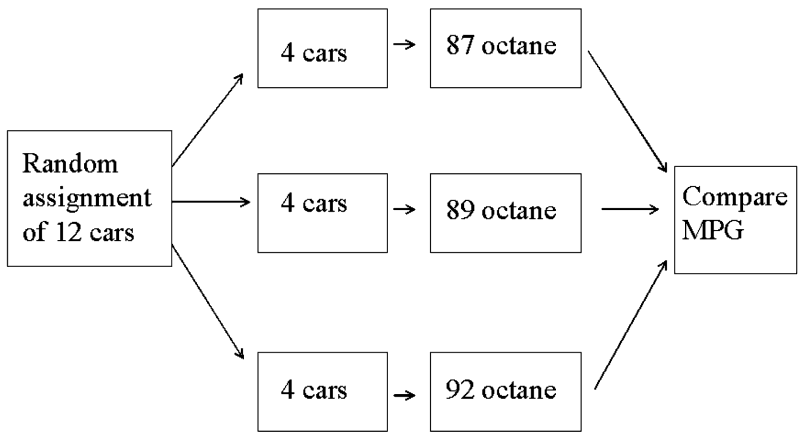
Each experimental unit is randomly assigned to a treatment. For example, 12 cars are randomly assigned to three octane levels to compare miles per gallon.
Matched-Pairs Design
Experimental units are paired based on relatedness (e.g., same person before and after treatment). Only two levels of treatment are used. Random assignment of treatment order helps control for order effects. Double-blinding is recommended.
Randomized Block Design
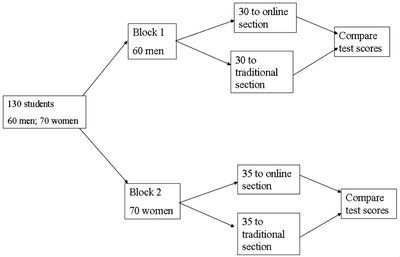
Experimental units are divided into homogeneous groups (blocks), and within each block, units are randomly assigned to treatments. This controls for confounding variables. For example, students are blocked by gender before assignment to traditional or online courses.
Summary Table: Sampling Methods
Sampling Method | Description | Example |
|---|---|---|
Simple Random Sampling | Every sample of size n has equal chance | Randomly select 5 students from a class |
Stratified Sampling | Divide population into strata, sample from each | Sample 4 Republicans, 4 Democrats, 1 Other from Senate |
Systematic Sampling | Select every kth individual | Sample every 3rd bottle from a production line |
Cluster Sampling | Sample all individuals in randomly selected groups | Survey all students in 10 randomly selected classes |
Convenience Sampling | Sample easily obtained individuals | Survey people at a mall |
