 Indietro
Introductory Statistics: Data Collection and Types of Data
Guida di studio - Note intelligenti
 Appunti personalizzati basati sui tuoi materiali, ampliati con definizioni chiave, esempi e contesto.
Introduction to Statistics
Statistics and Data
Statistics is the science of collecting, organizing, analyzing, and interpreting data to make informed decisions. Data refers to information gathered from counting, measuring, or collecting responses. Understanding the distinction between populations and samples is fundamental in statistics.
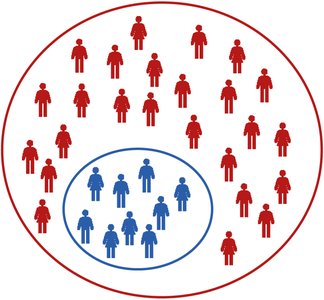
Population: The entire set of individuals or items of interest (e.g., all employees at a firm).
Sample: A subset of the population, selected for study (e.g., 12 out of 100 employees).
Parameter: A numerical value summarizing a characteristic for the whole population.
Statistic: A numerical value summarizing a characteristic for a sample.
Example: If the average salary of all employees is $41,000, this is a parameter. If the average salary of a sample of 12 employees is $58,000, this is a statistic.
Types of Data
Qualitative vs. Quantitative Data
Data can be categorized as qualitative or quantitative. Qualitative data describes qualities or categories, while quantitative data represents numerical values.
Qualitative Data: Describes attributes or categories (e.g., favorite color, eye color).
Quantitative Data: Represents numerical measurements or counts.
Subtypes of Quantitative Data
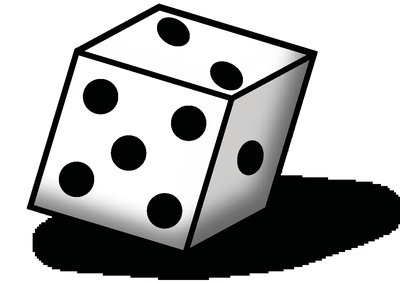
Discrete Data: Consists of distinct, separate values (e.g., number of students in a classroom, dice roll outcomes).
Continuous Data: Can take any value within a range and can be broken down further (e.g., time, temperature).
Example: Surveying the nationalities of people is qualitative. Measuring the distance people walk is quantitative and continuous.




Levels of Measurement
Classification of Data
Data can be further classified by levels of measurement, which determine what types of mathematical operations are meaningful.
Level | Description | Qualitative/Quantitative | Example |
|---|---|---|---|
Nominal | Categories, names, or labels; no order; no calculations | Either | Hair color |
Ordinal | Ordered categories; differences are not meaningful | Either | Letter grades, satisfaction ratings |
Interval | Meaningful differences; no true zero; ratios are meaningless | Either | Temperature (°C or °F) |
Ratio | Meaningful differences; true zero; ratios are meaningful | Either | Heights, distances |
Example: Birth years are interval data; satisfaction ratings are ordinal; working hours are ratio.
Collecting Data
Observational Studies vs. Experiments
There are two main ways to collect data: observational studies and experiments.
Observational Study: Researchers do not change anything; they simply observe and measure characteristics. Causation cannot be assumed.
Experiment: Researchers apply a treatment and measure its effects. Causation can be inferred if the experiment is well-designed.
Example: Testing a medication by giving some subjects a placebo and others the actual medication is an experiment.
Taking a survey about sleep habits and grades is an observational study.

Rolling a fair and a loaded die and comparing results is an experiment.

Sampling Methods
Simple Random Sampling
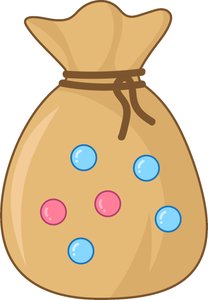
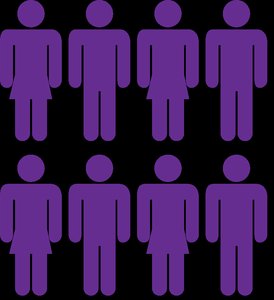
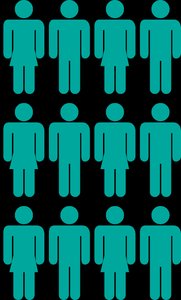
Sampling is the process of selecting a subset (sample) from a population. A representative sample accurately reflects the characteristics of the population. In simple random sampling (SRS), each subject and each possible group are equally likely to be chosen.
Other Sampling Methods
Systematic Sampling: Select every nth subject from the population.
Cluster Sampling: Divide the population into groups (clusters), then randomly select one or more clusters and survey all subjects within them.
Stratified Sampling: Divide the population into groups (strata) based on shared characteristics, then randomly select subjects from each stratum.
Example: A bakery tests every 12th cookie (systematic sampling). A university surveys random undergrads and grad students (stratified sampling). Randomly selecting one class per grade and surveying all students in the class (cluster sampling).

































Summary Table: Sampling Methods
Method | Description | Example |
|---|---|---|
Simple Random Sampling | Each subject/group equally likely | Randomly select 5 students from 20 |
Systematic Sampling | Select every nth subject | Test every 12th cookie |
Cluster Sampling | Divide into clusters, select whole clusters | Survey all students in randomly chosen class |
Stratified Sampling | Divide into strata, select from each stratum | Survey random undergrads and grad students |
Additional info: Academic context and examples were expanded for clarity and completeness.
